Author: Adam Simmons
With special thanks to Mark Rejhon
Last updated: September 16th 2025
Table of Contents
Introduction
If you ask a user what they look for when buying a monitor they may respond by saying “a good resolution”, “good colours” or “good image quality”. Some users, particularly gamers, are also quite particular about the motion performance of a monitor and will be looking for something that is responsive. As with other factors affecting the overall image quality, there are a lot of different aspects to consider here. Unfortunately for the consumer, a true picture of ‘responsiveness’ is never painted by manufacturer specifications. In this article we break through the confusion, taking a detailed look at the key factors affecting responsiveness.
Input lag
When considering the responsiveness of a monitor you must consider what the user feels when trying to interact with the monitor as well as what they see with their eyes. Input lag is all about the delay between the graphics card sending a frame to the monitor and the monitor displaying that frame. The basic component of input lag which affects the feel is referred to as the signal delay and is commonly measured in milliseconds. There are of course other sources of latency beyond simply this signal delay and not all of it comes from the display itself. This is covered in this excellent article by AnandTech, but we shall be focusing on just the monitor here. A lower input lag is advantageous because it leads to a snappier feeling when you interact with the display using your mouse or other controller.
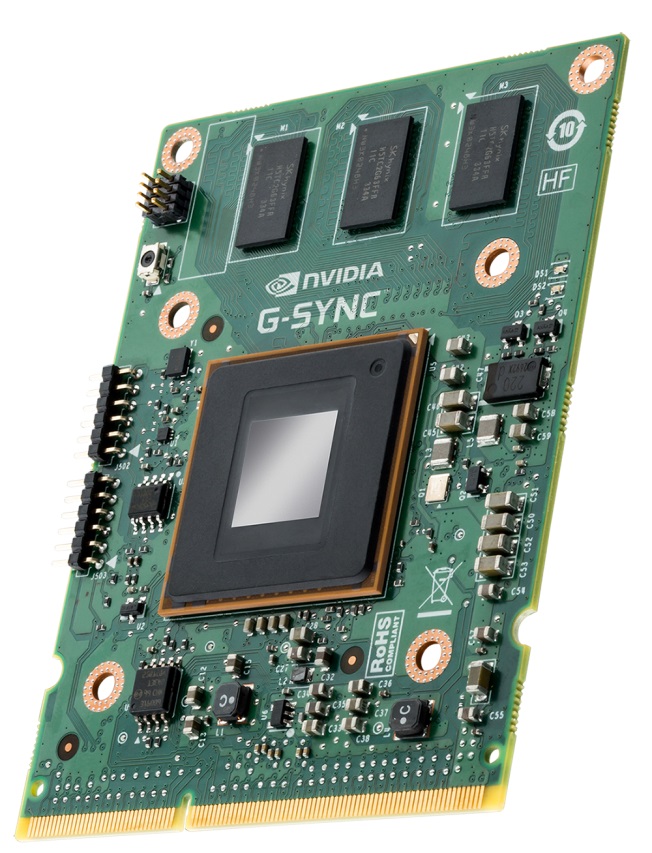
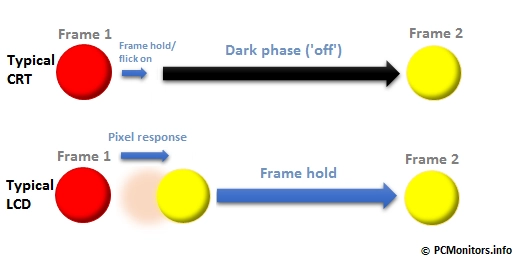
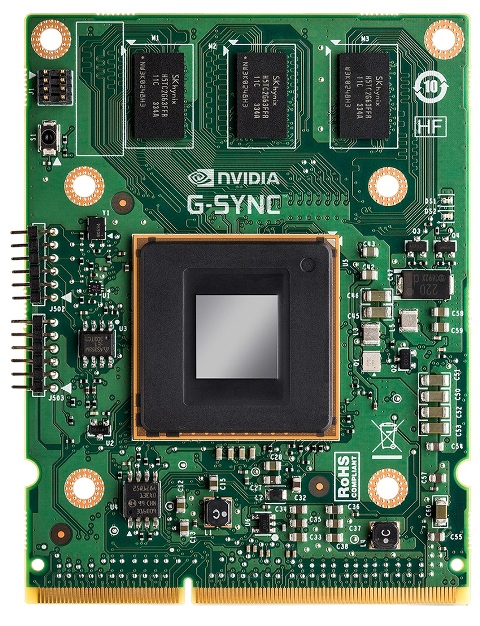
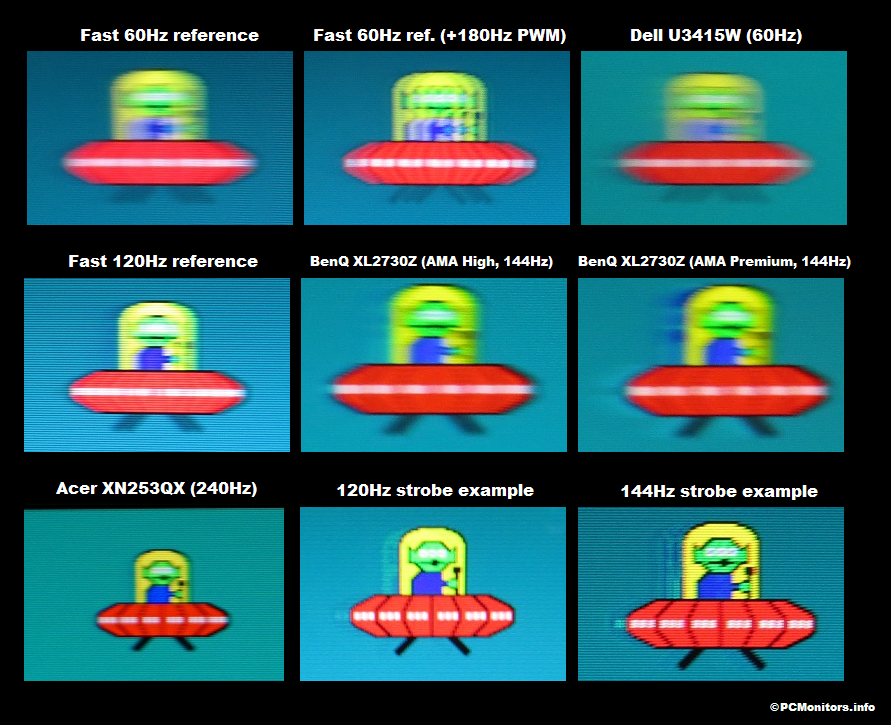
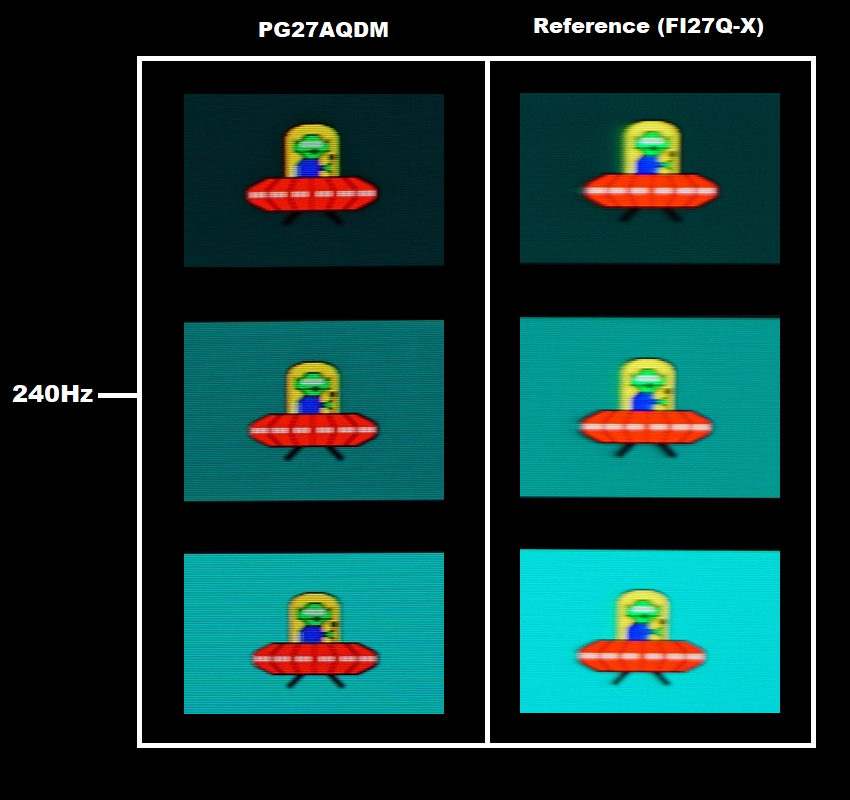
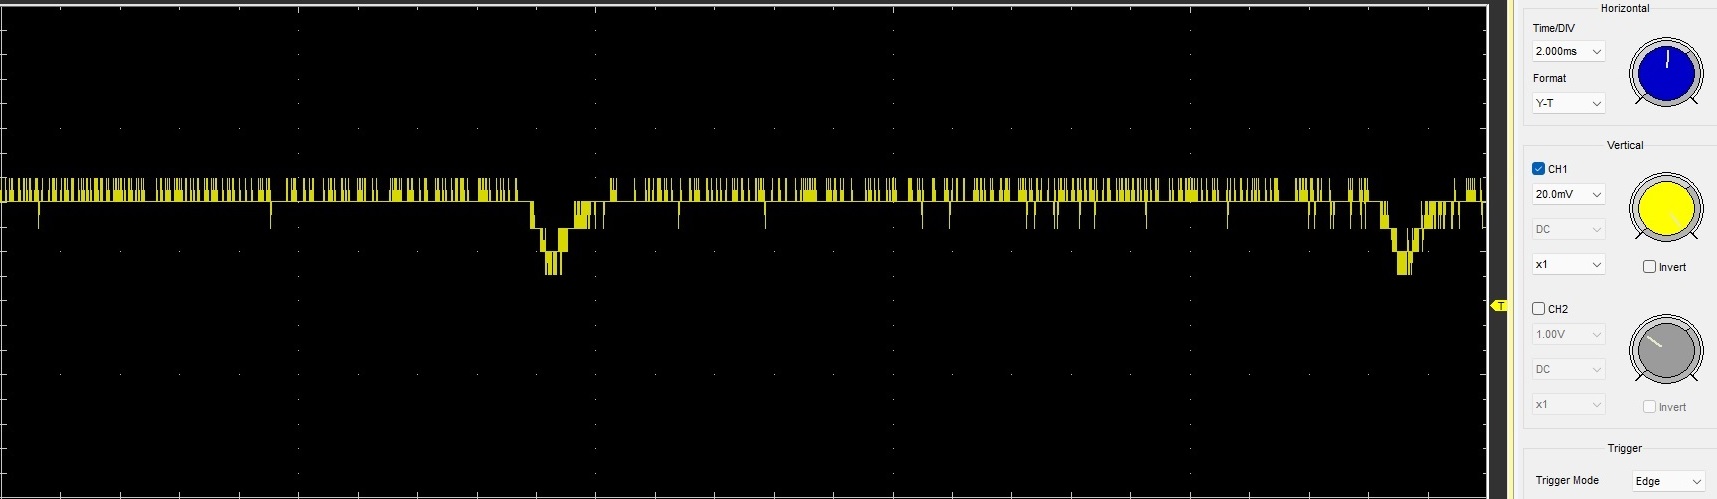
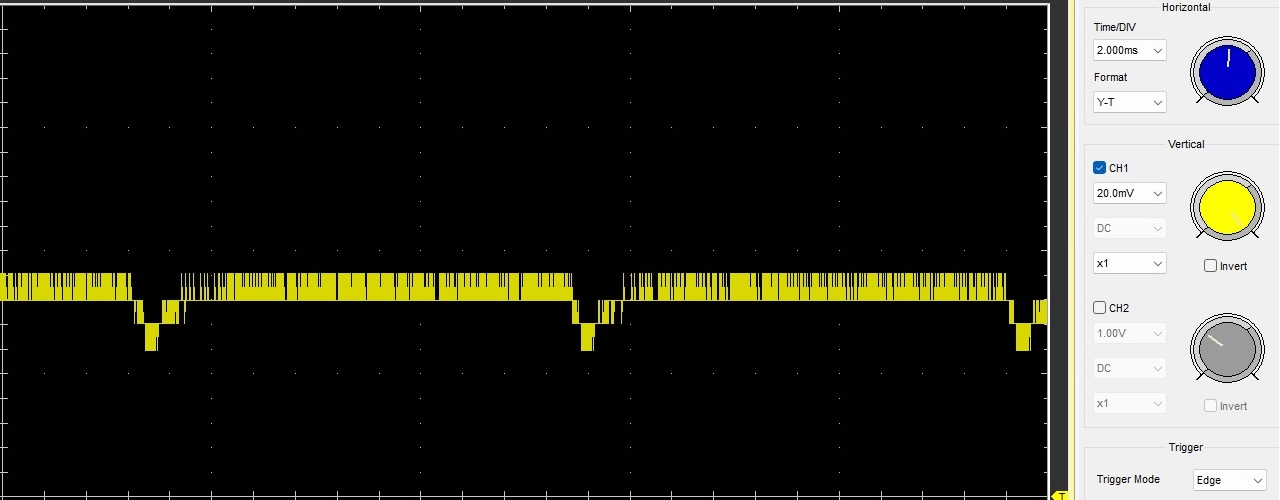
Monitors will process the image in various ways before outputting it – some models do this more extensively than others. It is not too uncommon for higher end screens in particular to use internal scalers to handle non-native resolutions, which can add significant input lag. Sometimes the signal must pass through the scaler even if scaling is not required (i.e. running the monitor at its native resolution). Manufacturers will sometimes give PC monitors a dedicated mode which will bypass much of the signal processing; sometimes a dedicated ‘low input lag’ or similar setting that can be activated through the OSD (On Screen Display). To measure the signal delay accurately requires specialist equipment such as an oscilloscope and photo diode. This will allow you to specifically determine the signal delay rather than the overall latency. Often when websites or users measure input lag they will be using a camera to capture apparent differences between a display of known input lag and their display of choice. This will be done using a stop clock or special software such as SMTT (Small Monitor Test Tool). Such methods can give a reasonable idea of input lag, particularly if you have a good reference screens (known input lag) to benchmark against. Because they rely on a visual interpretation of a display’s output they are influenced by the pixel transitions themselves (response time) and not just the pure signal delay. It is important to differentiate between these two as the signal delay significantly affects how responsive a monitor feels. Response times primarily affect how the monitor looks, as we focus on later. What we ‘see’ and ‘feel’ can of course be closely connected. But really, the pixel response affects what we like to call ‘visual latency’ rather than ‘felt latency’. It’s often included in what most websites and users will refer to as input lag, though what people are usually more interested in is how the monitor will feel, which is more heavily weighted towards the signal delay element. The next factor worth considering affects how responsive the monitor feels and looks to the user; refresh rate. Traditionally, LCD monitors run at a refresh rate of 60Hz under their native resolution. This means that up to 60 discrete frames of information can be displayed every second with a 16.66ms ‘gap’ between frames. This value can be altered to a degree, but there’s a defined maximum. An increasing number of monitors now run in their native resolutions at a refresh rate of 120Hz or higher (e.g. 144Hz, 165Hz, 240Hz etc.). A 120Hz refresh rate allows the monitor to display twice as much information every second, outputting up to 120 discrete frames of information with a 8.33ms ‘gap’ between frames. The diagram below gives a visual demonstration of these differences. In this diagram the 60Hz monitor shows a progression of a single frame, between Frame 1 (red blob) and Frame 2 (yellow blob). Over this same 16.67ms time period the 120Hz monitor has progressed two frames, displaying ‘Frame 2’ after 8.33ms and moving on to ‘Frame 3’ (green blob) by the end of the 16.67ms period. What this means in practice is that the 120Hz monitor is able to output content at up to 120 frames per second. At this frame rate each discrete frame is displayed for half the length of time compared to a 60Hz monitor running at 60fps. This reduces the level of perceived blur and increases the visual fluidity of scenes, as we’ll come onto later. The monitor also responds twice as frequently to user input updates, such as mouse movements, which when combined with relatively low input lag gives the user superior feedback and a much more ‘connected’ feel. For these reasons such models are popular amongst gamers and also facilitate smoother active 3D playback. Models with even higher refresh rates are now quite ubititous. As you can hopefully appreciate from the above there is a very close relationship between refresh rate and frame rate – or the monitor and the rest of the system. It’s all good and well having a monitor with a high refresh rate, but to gain maximum benefit from it the frame rate needs to keep up with the refresh rate. Some users like to use ‘VSync’ to prevent the frame rate exceeding the refresh rate and to ensure that the GPU only sends new frames to a monitor when it’s ready to move onto its next refresh cycle. With the GPU holding frames in this way there is an inherent delay which adds to the overall input lag. This ‘penalty’ becomes less severe as the refresh rate increases but it still exists. With VSync enabled you also get a degree of stuttering on occasions where the frame rate falls below the monitor refresh rate. This leads to a situation where the screen has finished drawing a frame and should be moving onto the next frame, but the GPU isn’t ready to send it. The GPU therefore sends the first frame to the monitor again instead of sending a new one – so the monitor redraws the frame. To minimise latency and stuttering as much as possible you can disable VSync instead, which many gamers do. But then the frames being sent to the monitor and the monitor’s refresh cycle are left to go out of sync. So the monitor ends up displaying new frames in the middle of its refresh cycle. Because monitors typically refresh from top to bottom you end up with a new frame being displayed only on the top of the monitor, whereas the bottom of the monitor is still displaying the old frame. This leads to ‘tearing’, either with distinct tear-lines or an associated displacement of objects (‘juddering’). This is potentially distracting and unsightly, which is exactly what leads some users to turn to VSync. But there are some alternative solutions, one of which is Nvidia G-SYNC. What the little chip below does is dynamically adjusts the refresh rate of the monitor to match, in real time, the frame rate of a game or other content. That way you gain the traditional benefits of having VSync enabled with the benefits of VSync disabled all at the same time. The chip can only be used on certain monitors, most of which will have it pre-installed in the factory. As of 2024, the full functionality of the Nvidia G-SYNC module has been incorporated into certain MediaTek scalers. This eliminates the need for a separate G-SYNC module, streamlining the production process and reducing costs. If you’d like to know more about the experience, check out our dedicated G-SYNC article which tells you more about the technology and the benefits it can bring alongside links to any relevant news pieces or reviews of G-SYNC models we’ve tested. AMD also has a variable refresh rate (VRR) technology dubbed ‘FreeSync’ which doesn’t require the same sort of specialist hardware inside the monitor itself. FreeSync technology was initially demonstrated on a laptop using the native capabilities of its eDP (embedded DisplayPort). For desktop monitors the DisplayPort 1.2a and more recent DP specifications support VRR (referred to by VESA as ‘Adaptive-Sync‘), via an optional extension. This has been pivotal to making AMD FreeSync a reality for the consumer. Newer iterations of the technology also work over HDMI on many monitors. Adaptive-Sync can also be used by other graphics hardware, including 10th Generation Intel Core “G” CPUs, more recent Intel processors and discrete graphics hardware. Nvidia now assesses Adaptive-Sync capable monitors for VRR compatibility on Nvidia GPUs (GTX 10 series and newer). If a monitor passes this testing, it’s marked by Nvidia as ‘G-SYNC compatible’. This means the models provide a ‘G-SYNC like’ (Adaptive-Sync) experience for Nvidia users even though the monitor itself isn’t a ‘full fat’ G-SYNC model with G-SYNC module. Some Adaptive-Sync capable models not marked as ‘G-SYNC compatible’ may still work with the technology on Nvidia GPUs, but the company makes no guarantees the VRR side of things will work properly if at all. This is something we now test in our reviews of Adaptive-Sync capable monitors. A key advantage of ‘full fat’ G-SYNC (complete with module or MediaTek scaler with ‘full G-SYNC’) that isn’t usually carried over to Adaptive-Sync models is variable overdrive. Normally, the optimal pixel response time setting of a monitor that applies to its maximum refresh rate will not be optimal if that refresh rate falls. As it does during frame rate dips, with VRR technology enabled. The monitor is optimised using this setting at its maximum refresh rate, in terms of its balance between fast pixel responses and relatively low overshoot – concepts that are explored in the proceeding section. At lower refresh rates, the voltage surges required to speed up the pixel response times are not the same. And using this stronger overdrive impulse causes more noticeable overshoot, or more specifically overshoot that persists for longer and is therefore much easier to perceive. Without the pixel response behaviour changing, this increases further as refresh rate draws closer to the floor of operation. A term used to describe the lowest refresh rate supported by the monitor under VRR. Depending on the model and how things are tuned, this may be quite eye-catching and it would therefore be recommended that the user manually switches to a lower pixel overdrive level if their frame rate dips significantly below the ceiling of operation (maximum refresh rate) of the monitor. In contrast, G-SYNC modules or scalers with variable overdrive control automatically re-tune the pixel overdrive to a broad range of different refresh rates to strike a good balance between pixel response speed and low overshoot. HDMI 2.1 has its own integrated VRR standard as well, which can be accessed by devices such as the PS5 which don’t support Adaptive-Sync. It can also be leveraged via Nvidia GPUs (‘G-SYNC’) and in our testing it offers a very similar experience to using Adaptive-Sync on a particular model. The refresh rate clearly has a significant bearing on how responsive a display looks and feels to the user but it certainly isn’t the end of the story. In the previous ‘blob diagram’ you will recall there were ‘gaps’ between frames. On a CRT monitor these gaps are blank spaces where nothing is displayed on the screen – aside from the remnants of the image as it fades away due to phosphor persistence (a momentary ‘afterglow’, rapidly fading in intensity). At 60Hz a CRT will simply flick from one frame to the next like clockwork every 16.66ms, displaying each frame very briefly. This is why, particularly at lower refresh rates, the user may notice a flickering as the monitor alternates between displaying the gap and displaying a frame of information. The vast majority of LCDs (and some other non-CRT technologies) use a technique called ‘sample and hold’ to display their images. This means that a frame (sample) is displayed to the user (held) for the entire duration of the ‘gap’, after which the next frame is sampled and then held. Drawing the next frame isn’t instantaneous on an LCD, either. It is influenced by the pixel response time; the time taken to transition a pixel from one colour (state) to another. It doesn’t actually depend on the specific colour (e.g. red to blue vs. green to blue) but on the lightness or intensity of the shade. This is known as the greyscale or ‘grey’ value, running from the darkest shade (0% grey = black) to the lightest shade (100% grey = white). A transition from black to white, for example, will typically take a different length of time to a transition from 25% grey to white. Remember that in this instance grey simply refers to the intensity of the shade – it could in fact represent a colour such as dark blue (25% grey) or light blue (75% grey). It’s also worth noting that although the response time isn’t influenced by anything other than the grey values, some colour transitions may give more obvious trailing due to how receptive people are to particular colours. Pixel response times are commonly quoted by manufacturers as ‘grey to grey’ values with figures such as 1ms, 2ms or 5ms. Unfortunately there is no common measurement standard for this and, as explained above, not every pixel transition will occur at the same speed. Often the manufacturers will cherry pick their values so that they represent one of the most rapid pixel transitions a PC monitor will perform. Whilst some transitions may occur at the quoted speed, others might not happen anywhere near as quickly. The diagram below illustrates the difference between a 8ms pixel transition and one occurring twice as quickly (4ms). For clarity a standard sample and hold LCD with 60Hz refresh rate is used in this example. The top row in the diagram shows a transition occurring between a red blob (frame 1) and a yellow blob (frame 2) at a response time of 8ms grey to grey. After 8ms the completed yellow blob is displayed for the remaining duration of that frame (an extra 8.67ms). The bottom row shows this same transition but at a response time of 4ms grey to grey. The completed yellow blob (frame 2) is shown after only 4ms and then held for the remaining 12.67ms of the frame. The shorter time spent in the transitional phase between red and yellow leads to what is essentially less trailing or ghosting. In this example the transition occurs between one state (red) and another (yellow) and would go no further until a new transition is called for in the next frame. In reality rapid response times such as this are typically achieved on LCDs by using a pixel overdrive circuit external to the panel itself. This overdrive process is also known as RTC (Response Time Compensation) or grey to grey acceleration. Voltage surges are applied to ‘push’ the pixels into the desired state more rapidly – something that is very common on LCDs of all panel types. If the disparity between the native speed of a transition and the speed of the accelerated transition is great then it sometimes requires an aggressive voltage surge to achieve it. This will invariably lead to a situation where the transition won’t just stop at the desired endpoint but will actually ‘overshoot’. The consequences include visible artifacts (RTC errors) such as inverse ghosting. This may include ‘dirty trailing’ or ‘shadowy trailing’ that is darker than the object or background shades. Some may sub-categorise this as ‘undershoot’, as it results from a fall below the desired end point of the transition rather than a rise above it. Or it may include bright ‘halo’ trails, which are brighter than the object or background shades and may be quite colourful as in the example below. This form of inverse ghosting (overshoot) is particularly eye-catching and potentially more distracting than regular trailing. On modern TN monitors most grey to grey transitions occur at around 4-10ms without overdrive but can be pushed to as low as 1ms or slightly below using moderately strong overdrive. Without overdrive IPS-type panels are more sluggish, giving response times during grey to grey transitions typically around 8-16ms. With moderate overdrive some grey to grey response times on IPS-type panels can fall to around 3-6ms which can significantly reduce trailing. On most VA panels grey to grey transitions are very sluggish and usually occur between 14ms and 30ms without overdrive. With moderate overdrive you can bring some of these transitions down to around 4ms whilst others will stubbornly remain well above 10ms. For all of these panel types balance is key. It is possible to drive down response times even further using more aggressive overdrive, but often the consequences of this (visible artifacts) outweigh the benefits. The image below gives an extreme example of the visual joys that can accompany the use of very aggressive pixel overdrive. Any long-term CRT users, particularly gamers, will recall that there was a distinctly different feel to gaming on a CRT. Modern LCDs have generally rapid response times and high refresh rates which certainly help reduce trailing and perceived blur. But still there is something missing. Objects that remained sharp during brisk movements on the CRTs may seem relatively blurry on even the fastest LCDs. As mentioned in the opening paragraph of the previous section, there is a distinct difference between how CRTs and most LCDs sample images. It is this that is the missing piece of the jigsaw and the major factor in perceived motion blur. LCDs and OLEDs typically adopt a ‘sample and hold’ (or ‘follow and hold’) approach to displaying an image whereby a frame (sample) is displayed to the user until the next frame needs to be drawn (hold). In contrast, CRTs use an ‘impulse-type’ approach whereby each frame is flicked on momentarily and then no new information is shown on the screen until the next frame is required. Let’s summarise these differences with another infamous ‘blob diagram’, this one being a sort of conglomeration of the two previous diagrams. The typical LCD is always displaying information, whereas the CRT only displays information for very short periods of time. The sample and hold approach used by your typical LCD monitor has consequences for the perceived clarity of motion. When your eyes track movement on such a display they are fed a continuous stream of information and are continuously moving. Your eyes are at various different positions throughout the screen refresh. This results in perceived motion blur – a blur that would persist even if the pixels themselves were transitioning extremely quickly. Some studies suggest that response time actually only accounts for around 30% of perceived blur on a 60Hz monitor with 16ms response time (Pan et al. 2005). On models with faster pixel response times it accounts for even less of the perceived blur. Refresh rate also plays an interesting role in all of this. At a refresh rate of 60Hz the pixel response times are only really a significant limiting factor in terms of overall perceived blur if they are above about 8ms, which is half of the frame refresh cycle. On a 120Hz PC monitor you need pixel response times to fall below ~4ms and for 240Hz below ~2ms for a strong performance, which is again half of the refresh cycle. Whilst minor clarity improvement can be seen if response times are improved beyond this, an increased refresh rate and frame rate is required to yield significant further improvement on a sample and hold monitor. This is why it is typically TN or increasingly fast IPS-type panels that make the best candidates for high refresh rates in LCD form. And why OLEDs will give a lot of headroom in this area. Pixel responses aside, the significance of eye movement and refresh rate really cannot be understated when it comes to motion blur. You will recall from earlier in the article that an increased refresh rate on an LCD improves the smoothness of motion because visual information is being fed to the user more rapidly. Trailing appears greatly reduced despite the pixel response behaviour typically remaining similar to when the monitor is running at 60Hz using the same overdrive settings. This increased smoothness is actually largely down to a decrease in perceived motion blur. Frames are being held for a much shorter duration and your eyes are being fed a greater number of distinct frames – as a result, your eye movements are reduced. But there is still a greater degree of eye movement and hence blur than on a CRT. On a CRT the information is flashed at you extremely briefly followed by no information (a blank screen). As a result, your eyes aren’t spending much time at all tracking motion and the perceived blur is significantly decreased. You can perform a quick demonstration of how eye movement influences perceived blur by looking at your mouse pointer on a sample and hold display. Stare at a fixed point on the screen while moving the mouse pointer across this point, moving the mouse at a moderate pace from side to side. The white space above this paragraph should give you a normal mouse cursor and an area to focus on. You should see a set of distinct mouse pointers as you move your mouse from side to side. Now allow your eyes to follow the mouse pointer and notice that you see a slightly blurry pointer rather than several distinct pointers. Don’t move the pointer too rapidly or do this too many times as you will probably make yourself dizzy. There are also some useful demonstrations of how influential eye movement is on this page. This is part of a broader collection of tests called ‘UFO Motion Tests’, which are designed to help users analyse the motion performance of their display. The animation below is one such demonstration – note how different the animation appears if you keep your eyes stationary (stare at top UFO) vs. track motion (follow the bottom UFO). PWM (Pulse Width Modulation) is a method used to modulate backlight brightness on some sample and hold LCDs and backlight or pixel brightness on some sample and hold OLEDs. There is an excellent article dedicated to this on TFT Central, well worth a read if you’re interested in learning more about it. Rather than using a varying direct current to modulate brightness, the PWM-controlled light source is rapidly ‘flicked’ on and off to achieve a given brightness. Some people are sensitive to this rapid flickering effect and can suffer from visual discomfort. The flickering also has repercussions for how ‘blur’ on moving objects is perceived on a monitor. Because the image disappears very briefly when the PWM-regulated light source flicks off there can be visible fragmentation in the blur we perceive when viewing moving images. The fragmented blur is termed a PWM artifact. The video below gives a rough idea of this effect. It is obviously constrained by the limitations of the camera recording the video and the video output (particularly the low frame rate), but the PWM artifacts manifest themselves in a similar way in practice. It’s also worth noting that this fragmentation reduces eye movement and can therefore have a positive effect on perceived blur via mechanisms discussed earlier and indeed in the following paragraph. It’s typical for sample and hold OLEDs to have a slight cyclical dip in brightness in sync with the refresh rate (175Hz QD-OLED trace example and 240Hz WOLED trace example). This is very different to the pronounced brightness changes accompanying PWM or strobing so shouldn’t be bothersome to most users. Such monitors can be considered ‘flicker-free’ as advertised, though sensitive users could still find the cyclical dips bothersome – particularly at lower refresh rates. ‘Normal’ LCDs and CRTs use a completely different sampling method, as explored previously. However; it is possible to modulate the backlight of an LCD monitor in such a way that it samples frames like a CRT and therefore provides a reduction in perceived motion blur. Scanning or strobe backlights are those that pulse ‘on’ and ‘off’ in much the same way as a CRT, allowing an LCD to display information to a user for only a fraction of a second every frame and display nothing at all for the remaining time. This impulse-type behaviour not only reduces motion blur by reducing the amount of time the eye spends moving, it also hides much of the pixel transition process – including overdrive artifacts that may be generated by aggressive grey to grey acceleration. One of the most popular systems used on LCD TVs is Sony ‘Motionflow’. Basic ‘Motionflow’ involves the use of MCFI (Motion-Compensated Frame Interpolation) technology whereby intermediate frames are created and inserted between real frames to increase refresh rate. ‘Motionflow XR’ combines this MCFI with a strobe backlight. ‘Motionflow Impulse’ uses a strobe backlight exclusively, without any sort of interpolation. Samsung uses an alternative called ‘Clear Motion Rate’ (CMR) that combines a strobe backlight on LCDs and pixel strobing or ‘Black Frame Insertion’ (BFI) on OLEDs with other motion enhancements. Panasonic also uses a strobe method they refer to as ‘Backlight Scanning’ (BLS) on some of their TVs. Strobe backlight technologies such as these are readily used by LCD TV manufacturers, whilst OLED screens sometimes offer pixel strobing or BFI modes. It’s not uncommon to see such modes available on high refresh rate PC monitors now as well, with a technology called ‘LightBoost’ responsible for spurring up initial interest in this. This is a low-latency strobe backlight technology developed Nvidia. It was designed to complement Nvidia’s 3D Vision 2 stereoscopic system. The shutter glasses, which are an integral part of 3D Vision and any ‘active 3D’ system, have the left and right lenses alternately open and close so that each eye sees a different frame and a 3D picture emerges. LightBoost-compatible monitors are able to shut off their LED backlights in between frames and momentarily pulse them on at very high brightness to display each frame. The ‘on phase’ (or pulse) may last a couple of milliseconds, if that, and peaks at a brightness exceeding the monitor’s usual static 100% brightness. The off phase lasts for the remainder of the frame duration; until a new frame needs to be shown to the user and the next momentary brightness pulse occurs. Using this technology, where the backlight itself is acting as a shutter, allows the shutter glasses themselves to remain open for longer and let more light in – hence the primary purpose of the technology and the name itself. Another advantage of this system is that the monitor is no longer ‘sampling’ like a regular LCD but rather like a CRT. Your eye movements are reduced due to the very short ‘on phase’. During its normal intended operation, where 3D content is being viewed with 3D Vision 2 glasses, crosstalk is reduced. But where things get really interesting is when you take away the shutter glasses entirely and start viewing 2D content. Because LightBoost is specifically designed for 3D viewing, using it for smoother (‘CRT-like’) 2D viewing can’t be done ‘officially’. However; it can be done very easily without any risk to your monitor or the rest of your system. An individual who goes by the pseudonym ‘ToastyX’ has developed a utility called ‘StrobeLight’ which allows a user to very simply toggle LightBoost on and off on compatible monitors without needing a 3D Vision 2 set or even an Nvidia graphics card. There are drawbacks to enabling LightBoost. Whilst the fluidity benefits are great if you’re running at a frame rate matching the refresh rate, there is rapid degradation in smoothness as the frame rate dips even slightly below this. In particular stuttering becomes much more pronounced as it isn’t masked by motion blur. The relative drop in apparent smoothness is far greater than for the equivalent frame rate drop with LightBoost disabled and some users will actually find disabling LightBoost preferable. In other words if you can’t maintain high frame rates ideally equal to the refresh rate then you can end up with an inferior rather than superior motion experience. Another key issue is that OSD control of the image is shut off and image quality is adversely affected – it is, after all, designed for a 3D viewing environment with active shutter glasses rather than direct 2D viewing. The image appears dimmer, more muted and colour balance is affected to varying degrees (depending on monitor model). There is also a mild flickering similar to what you would observe on a 120Hz CRT. There are individuals who are adversely affected by the PWM (Pulse Width Modulation) used on many LCD monitors but find this CRT-like flickering perfectly tolerable. There are other users who find the added fluidity of the image actually helps with eyestrain and related problems, whilst others dislike the CRT-like flickering which is of a different nature to PWM flickering. Some of the image imbalances mentioned can be partially addressed by adjusting values such as gamma and colour channels in the Nvidia Control Panel or Catalyst Control Centre. It also helps to set contrast as high as it will go without lighter shades becoming badly crushed or bleached, using an appropriate reference that will show when light shades start blending into bright white too readily. Image quality aside, the motion blur reduction that can be achieved by LightBoost during normal 2D viewing (at high frame rates) is reason enough for some people to use it. We’ll explore just how much difference it can make to motion blur shortly, but first we’ll take a quick look at some alternative computer-based technologies that follow similar principles. Enabling LightBoost makes a significant difference to the level of motion blur a user experiences. The activation process may seem a bit ‘hack-like’, but that’s because LightBoost is only officially endorsed for use as a 3D feature and is being exploited for its 2D blur-reduction benefits. Samsung’s now discontinued SA750 and SA950 series 120Hz monitors had similar functionality integrated into it with its ‘Frame Sequential’ 3D mode. This sets the backlight into a strobe mode that was intended for 3D viewing but could also be used for viewing in 2D with reduced motion blur. Many manufacturers have now adopted strobe modes designed specifically for blur reduction during 2D viewing. This is advantageous as the image can be optimised for 2D viewing and activating the strobe function doesn’t have quite the same negative effect on colours as LightBoost does. As with LightBoost there is a reduction in perceived brightness and the monitor will ‘flicker’ like a high-refresh rate CRT as the backlight strobes. You also get rapid degradation in the smoothness of motion and the appearance of quite noticeable stuttering if the frame rate drops much below the refresh rate of the monitor; the strobe must be closely synchronised with the monitor’s refresh rate to be effective in reducing motion blur. There are many alternative strobe backlight settings now offered by manufacturers. EIZO, a manufacturer focused primarily on high-end monitors, was an early adopter of strobe backlight technology designed for 2D viewing. The EIZO FDF2405W and FG2421 were two such monitors using this technology. These models employ stroboscopic backlights, using a process dubbed ‘Turbo 240’ on the gaming model, to help reduce motion blur and overcome some of the inherent responsiveness limitations of their VA LCD panels. Here, some of the inherently slow VA pixel transitions can be partially hidden during the extended ‘backlight off’ periods. BenQ have also adopted a strobe backlight mode named simply ‘Motion Blur Reduction’, first seen on the XL2720Z, XL2411Z and XL2420Z 144Hz gaming monitors. This can be used in conjunction with a range of refresh rates which will help users who are unable to maintain a frame rate matching the refresh rate of the monitor (for example 144fps on a 144Hz model). Some strobe backlight technologies include: You may recall that we touched upon Nvidia’s G-SYNC earlier in the article as a variable refresh-rate technology designed to reduce latency, eliminate stutter and prevent tearing. If you have read our article on the topic you may have noticed mention of ‘Ultra Low Motion Blur’ (ULMB). This is something that can be activated on many G-SYNC monitors. It stemmed from an interest by Nvidia and the monitor manufacturers in LightBoost from a 2D perspective, particularly amongst gamers. The focus was shifted from supporting stereoscopic 3D to reducing perceived blur under normal viewing. A range of refresh rates are supported, depending on model, which is useful for users who can’t match the refresh rate with their frame rate. Some 144Hz+ models with ULMB can be run at 100Hz or 85Hz if a user can only maintain 100fps or 85fps, for example. ULMB 2 is also available on some models, promoting higher brightness, allowing separate overdrive tuning for different sections of the panel and working at higher refresh rates such as 360Hz. As with many strobe backlight technologies you can’t use VRR (G-SYNC in this case) at the same time as ULMB or ULMB 2 – unless the monitor supports G-SYNC Pulsar specifically. If you are familiar with some of our earlier reviews you will also be familiar with a small tool called PixPerAn (Pixel Persistence Analyser) that can be used to analyse pixel responsiveness. It is also useful to help reinforce some of the earlier points about what a strobe or impulse-type display does and how this is different to a traditional sample and hold display. The image below shows a photograph taken from PixPerAn on the Samsung S27A750D (120Hz LCD) using its ‘Faster’ response time setting. Because the backlight is constantly illuminated, this is fairly representative of the pixel response behaviour at any given time when running this test. You can see a ‘woven’ trail behind the original image, indicating the presence of mild overdrive artifacts but a decent overall pixel responsiveness for these transitions. The three images below show the sequence of events that can be captured with the S27A750D set up in exactly the same way apart from having its ‘Frame Sequential’ strobe backlight mode activated. The first photo shows the dark phase, which is the state the monitor is in most of the time when its backlight is set to strobe. The backlight is off and no image can be seen. The second image shows the backlight during its bright phase, with the backlight very briefly pulsing to a brightness that exceeds anything possible with ‘Frame Sequential’ disabled. You can also observe that the trailing is very faint indeed and it is hidden along with any overdrive artifacts. As noted in this article and in some of our more recent reviews, though, the movement of our own eyes is a significant cause of motion blur. This isn’t something that is reflected by analysis using PixPerAn, traditional static photography or videos. But what if you capture a photo using a moving camera rather than a stationary one, creating motion blur in the image that is similar to that created by eye movement? That is something we will come onto shortly. The UFO Motion tests aren’t just good for providing visual demonstrations of some of the concepts explored in this article, they’re also useful if you want to try to quantify the differences as well. You can use this test to calculate a value known as MPRT (Moving Picture Response Time). Put simply the MPRT reflects the overall level of perceived motion blur on a monitor taking into account eye movement primarily with lower values indicating less motion blur. The test allows you to employ a range of pixel transitions, ranging from black (grey 0%) to white (grey 100%) with 25%, 50% and 75% grey steps in between. Because MPRT is designed to reflect the ‘overall visual responsiveness’ the refresh rate and sampling behaviour of the monitor are really the primary factors. Particularly slow pixel responses can increase MPRT values slightly as well; trailing may be visible in such cases that goes beyond the scope of perceived blur due to eye movement. This is why you should assess as many different pixel transitions as possible to gain a representative MPRT. Another thing you tend to find on modern monitors is that certain pixel transitions may be particularly affected by overdrive artifacts where aggressive grey to grey acceleration is used, as discussed previously. Such artifacts can certainly affect the perceived quality of motion but don’t generally have a significant effect on the MPRT and should therefore be considered separately. The graph below shows the Moving Picture Response Times (MPRTs) for a range of PC monitors. All screens are set up as detailed in their respective reviews, but note that the S27A750D in frame sequential mode has its brightness set to ‘100’. The MPRTs given for each display are an average including transitions between every grey level available in the test (0, 25, 50, 75 and 100). The transitions are done both ways, for example white to black is tested as well as black to white. The monitors include a range of different panel types (TN, VA, IPS and PLS) as well as refresh rates (60Hz, 72Hz, 120Hz, 144Hz and 240Hz). Models that are regular ‘sample and hold’ are given blue bars whereas those with strobe backlights have green bars. The graph above shows that 60Hz sample and hold displays all have MPRT values of around 16.67ms. The 120Hz Samsung has an MPRT of 8.33ms which is half that of the 60Hz displays, whereas the VG248QE and PG278Q have MPRTs of 6.94ms at 144Hz. The XG2530, meanwhile, has an MPRT 4.16ms at 240Hz. Some of these numbers may sound rather familiar, especially if you have carefully read the ‘Refresh rate’ section of this article. The figures mirror the delay between frames and again stress the importance of refresh rate as the predominant limiting factor in perceived fluidity on a modern sample and hold display. The displays with IPS panels (such as the Dell P2414H and AOC q2963Pm) have typical pixel response times of around 6-8ms. Nonetheless they are not outperformed by the ASUS VG248QE here when it is set to the same 60Hz refresh rate, despite the ASUS having very snappy pixel response times typically around 2ms. Also interesting is that when the AOC q2963Pm is overclocked to 72Hz, the MPRT decreases despite the monitor making no adjustments whatsoever to its pixel response times. All of this indicates that refresh rate is the main influence on the level of motion blur for these displays and hence the MPRT; mirroring the previously explored theory. The models with VA panels have slightly higher MPRT values than you might expect from their 60Hz refresh rates. The reason for this is that some of their pixel transitions are slow enough to create noticeable trailing that isn’t ‘hidden’ by the perceived blur from eye movement. Because the MPRTs given here are averages across all transitions, these slow transitions increase the final figure. On the other end of the spectrum we have the monitors where strobe backlights are employed, giving MPRT values of between 1.30ms and 2.33ms. These values are far lower than can be achieved at their respective refresh rates using sample and hold, indicating the significant impact that a strobe backlight has on perceived blur and MPRT. Another important point to raise here is that with LightBoost set to 10% on the VG248QE, the MPRT is significantly lower than with LightBoost set to 100%/Max (1.39ms vs. 2.33ms). A similar pattern is observed on the ULMB PW (Ultra Low Motion Blur Pulse Width) set to ’10’ instead of ‘100’ on compatible models. That is because the strobe length (i.e. length of time the backlight is illuminated) is decreased when LightBoost or Pulse Width is set to a lower value, which decreases motion blur but also decreases brightness. Even with LightBoost or Pulse Width set to ‘100’, though, the improvement in motion fluidity at high frame rates is significant. If you’re interested in further study into MPRT there is a wide range of ever-expanding existing literature available on Google Scholar. Another way of looking at this data is to consider a value known as MMCR (Measured Motion Clarity Ratio). As with MPRT this measurement gives a quantitative representation of the level of perceived blur when viewing moving images on a monitor and can be calculated for a display using the UFO Motion tests. We saw above that the MPRT value on a sample and hold display closely mirrors the delay between frames on that display, with lower values representing lower levels of perceived blur. In order for much lower MPRTs to be recorded, an impulse-type sampling method must be used. This is achieved by a strobe backlight, for example. Let’s take a look at what the MMCR values look like for the displays we tested. You can see in the graph above that for sample and hold displays the MMCR closely mirrors the refresh rate. To reinforce some points raised earlier; at a higher refresh rate the delay between frames is shorter and each frame is ‘held’ for a shorter length of time. The eyes are given more unique positional information on the screen and spend less time moving, reducing blur from eye movement. This strongly influences the MMCR, where this time a higher value indicates a lower level of perceived blur. You may also notice, looking at the figures, that the VA models have MMCRs that are lower than the other panel types at the same refresh rate. This is because, as explored in the MPRT analysis, there are some pixel transitions that are slow enough to create additional motion blur on top of that linked to eye movement. The models with strobe backlights are again able to break free from the constraints of refresh rate and cause the eyes to move a lot less, greatly reducing blur and providing significantly higher MMCR values as a result. As explored earlier, pixel responsiveness is commonly specified using a grey to grey (GtG or G2G) response time measurement. This value represents the time it takes for a pixel to transition from one shade (grey level) to another. Manufacturers will often specify one of the faster pixel transitions that the monitor will perform, sometimes using a relatively aggressive pixel overdrive settings (if available). And will typically measure a luminance change from 10% to 90% brightness (i.e. not the full transition). All of this leads to figures that can look rather good on paper and can certainly entice buyers. Yet regardless of how rapid your grey to grey response time might be, there’s that overarching perceived blur due to eye movement to consider. This is where MPRT comes in, as a method of measuring the length of time that a pixel is visible for rather than simply how quickly it transitions from one shade to another. This is a very useful benchmark for impulse-type displays, such as strobe backlight LCDs. We’ve introduced how MPRT can be measured in a realistic way in the previous paragraph and have also shown how measuring this properly clearly differentiates sample and hold vs. impulse type displays. As with GtG measurements, the methodology used by manufacturers lends itself to producing some very nice low numbers that don’t always accurately reflect real-world performance. It’s again a luminance change from 10% to 90% that’s considered rather than the full 0 – 100%. This can lead to figures that appear nice and low on paper, with ‘1ms MPRT’ being quite a common specification for 144Hz+ displays with a strobe backlight. Overly optimistic figures from manufacturers aside – when used properly – grey to grey response times and MPRT response times both provide useful but very different information about the motion performance of a display. Further exploration on this topic can be found on this Blur Busters article. Earlier sections of this article have focused on why we can’t just rely on pixel responsiveness or static photography to show how motion on a monitor will appear to a user. The movement of our own eyes is the most significant contributor to motion blur on typical modern (sample and hold) monitors, rather than pixel responsiveness. It is possible to give an accurate representation of what the eye sees in terms of motion blur and pixel responsiveness imperfections by using a technique called ‘pursuit photography’. By moving the camera at a steady speed, which matches the pace of action on the screen, it is possible to give an accurate representation of what the eye sees when it observes movement on the monitor. To capture the images below we followed a similar methodology to that explained by Blur Busters. The technique has also been covered in a peer-reviewed research paper, which is an interesting read for solid scientific background on the technique – the science behind it and what exactly it shows. The images below were captured with the UFO Motion Test for ghosting running at 960 pixels per second, with the UFOs moving from left to right as always. The middle row of the test (medium cyan background) was used. This is a good practical speed for such photography and allows accurate analysis of both perceived blur and pixel response behaviour. Four monitors are used in this analysis. The ‘reference’ monitor is the Samsung S27A750D, capable of a 120Hz refresh rate and able to use three main backlight operating modes. The very first picture shows this monitor set to 60Hz using its ‘Faster’ response time setting and ‘100’ brightness so that the backlight is DC regulated. Here the pixel responsiveness is fast enough for optimal 60Hz performance (i.e. comfortably <8ms for all transitions displayed) without introducing any noticeable overshoot. The considerable blurring of the UFO is purely linked to eye movement and captured accurately by the pursuit camera. The second image shows this monitor set up in the same way but with the backlight brightness set to '50', therefore causing the backlight to operate using PWM at a 180Hz cycling frequency. You can see the fragmented trailing which we described earlier, with the object appearing to be broken up with three distinct repetitions. The third image shows the Dell U3415W, which as explored in the review does not provide pixel transitions that are consistently fast enough for optimal 60Hz performance. That is why you can see not only blur caused by eye movement (as with the reference screen) but also some trailing behind the object. Moving onto the second row, the first image there shows the S27A750D at 120Hz with response time set to ‘Fastest’ and brightness set to ‘100’. This allows the monitor to perform the pixel transitions shown in this test fast enough for optimal 120Hz performance (<4ms) and also ensures the backlight uses DC dimming for fair comparison with the remaining pictures on the row. You can see that the UFO is considerably sharper compared to at 60Hz, which reflects the doubled refresh rate and hence significantly lower eye movement and reduced perceived blur. You can see a faint 'shadowy' trail, which is a bit of overshoot from these heavily accelerated pixel transitions. The second image on this row shows the BenQ XL2730Z set to use its ‘High’ AMA (Advanced Motion Acceleration response time) setting and maximum 144Hz refresh rate. You can see fairly similar overall motion blur to the fast 120Hz reference as you might expect from the closeness of the refresh rates. You can also see a bit of extra trailing, most notably a sort of ‘vapour trail’ behind the yellow UFO cockpit. This is a bit of overshoot. The final picture on this row demonstrates the more conspicuous overshoot that can occur if a monitor uses exceptionally aggressive acceleration, in this case BenQ’s ‘Premium’ AMA solution on the XL2730Z. You can see palpable inverse ghosting, with the colours of the UFO appearing to be inverted for the trail. The final row is there to demonstrate the effect of further increasing the refresh rate, or introducing a strobe backlight into the equation instead. The first image shows the Acer XN253Q X, set to 240Hz and using its default ‘Normal’ pixel overdrive setting. You can see clearer details and sharper focus of the UFO, reflecting a decrease in perceived blur from the increased refresh rate. The second image in this final row has the S27A750D set to its ‘Frame Sequential’ setting, causing the backlight to strobe at 120Hz. The final image shows the XL2730Z using its ‘High’ AMA setting and ‘Blur Reduction’ enabled with the refresh rate at 144Hz. This forces the backlight to strobe at 144Hz. In both cases you can see the main object (UFO) is significantly more distinct than on any of the other images, showing sharp detail for both the alien and its spacecraft. This reflects the massive reduction in perceived blur that accompanies the strobe backlight solutions and reinforces the sorts of MPRT and MMCR figures explored in the previous subsection. You can also see some distinct trails accompanying the UFO, but these are far fainter than the object itself and doesn’t cause that to lose clarity. The 120Hz example shows a bit of conventional trailing from pixel transitions not quite keeping up with the demands of the backlight strobe, whereas the 144Hz example shows some overshoot from the strong pixel overdrive solution used. All images here give a very accurate impression of how the eye actually perceives movement on a monitor at any moment in time and we have therefore adopted this photography method in our reviews. Unlike on LCDs, aggressive pixel overdrive isn’t required on OLEDs to speed up pixel transitions. They’re able to achieve pixel response times for transitions between all shades ~1ms and below, with minimal pixel overdrive. In contrast, even the fastest LCDs would require aggressive pixel overdrive (with associated strong overshoot) to reach this and would only be able to do so for specific pixel transitions. On the OLED side, this means no perceived weaknesses due to slower than optimal pixel responses – they’re very comfortably within the requirements for the refresh rates. And an experience that can be free from perceivable overshoot. On pursuit photos using the UFO Motion Test for ghosting, even small details such as the white notches on the body are clearer than on the fastest LCDs. This difference is easiest to appreciate at higher refresh rates, where the perceived blur due to eye movement is minimised and the effect of the pixel response element is more prominent than at lower refresh rates. The pursuit photos below show the ASUS PG27AQDM with 240Hz OLED panel and a Gigabyte AORUS FI27Q-X, which is a moderately fast IPS LCD also running at 240Hz. You can see a slight red fringe towards the left of the yellow UFO cockpit for the dark background (top row) on the PG27AQDM. This is related to the subpixel layout and very difficult to spot by eye with the UFO in motion or during normal dynamic content on the monitor. There’s certain degree of ‘powdery trailing’ for the LCD reference screen due to weaknesses in pixel response times, visible behind the UFO. The small white notches aren’t distinct enough to be counted due to pixel response time weaknesses and the resultant perceived blur. In the case of the ASUS, there are no observable weaknesses – a visually flawless sample and hold 240Hz performance. The UFO segmentation is more distinct than it appears in the photo whilst the white notches on the UFO body are easy to count as well – even more distinct than they appear in the photo. These sorts of small details appear more blended on sample and hold LCDs, even on LCDs with superior pixel responsiveness to the FI27Q-X. This translates to differences in perceived blur when gaming and observing common elements such as texture details or intricate bright and dark shade mixtures. Further examples can be found in our reviews of OLED models, including the ASUS PG27AQDM and AW3423DW. Even on LCD models with a refresh rate advantage, such as the BenQ ZOWIE XL2566K, this difference holds true during normal sample and hold operation. Whilst some pixel transitions are very snappy on that model (albiet with significant overshoot in places), it doesn’t perform so well where very bright shades like this are involved (TFTCentral test data and additional pursuit photography). The exceptional pixel responsiveness of OLED makes them excellent candidates for high refresh rates including those beyond the 240Hz tested above. And also for pixel strobing or BFI-style technologies – which aren’t available for the models tested above. When it comes to judging a monitor’s responsiveness manufacturers give us very little to go by. One of the key figures quoted in the specifications is ‘grey to grey response time’. In this article we’ve explored the importance of response times and why they are significant, but also why you must look beyond the single value specified by the manufacturer. We’ve also looked at why refresh rate is important and how response times and refresh rate intertwine to form a key part of how well a monitor will handle motion. Another layer to consider is ‘input lag’ which primarily affects how a monitor feels in response to a user’s input but depending on what is being measured may also affect how a responsiveness the monitor looks. This isn’t specified by manufacturers and is a concept that confuses a lot of users. The term is tossed around all too freely without a clear understanding of what exactly ‘input lag’ is referring to – pure signal delay vs. taking into account pixel response time as well. It must be stressed that, as with all elements of responsiveness, subjectivity is extremely important. Not every user has the same level of sensitivity to input lag or general motion performance and tolerances do differ. Another key piece of the jigsaw which users aren’t typically aware of is the role of sampling method and how the monitor’s illumination behaviour affects perceived motion blur. If the monitor is constantly displaying information (sample and hold) then the movement of our own eyes is the primary cause of motion blur in most cases. Increased refresh rate combined with increased frame rate can improve things here but there is a more efficient method for improving the situation. If the monitor’s light source is pulsing on and off (impulse-type display) then our eyes spend less time moving and you get less perceived blur. On modern LCDs strobe backlights can be used to great blur-reducing effect – and it seems that manufacturers are really starting to push this sort of technology through to PC monitors and not just TVs where it’s used more broadly. As things move away from LCD towards alternatives such as OLED technology, there are massive improvements in pixel response time and greater breathing space for higher refresh rates. But we can’t necessarily rely on the required super-high frame rates to accompany this, especially for more demanding content. Sampling method remains important – for the absolute lowest levels of perceived blur at a given refresh rate, manufacturers will need to adopt a strobe light source or BFI. As an Amazon Associate and Newegg Affiliate I earn from qualifying purchases made using the below link. Where possible, you’ll be redirected to your nearest store. Further information on supporting our work.
A stopwatch application
As an Amazon Associate I earn from qualifying purchases made using the below link. Where possible, you’ll be redirected to your nearest store. Further information on supporting our work.

Many people have become obsessed with comparing input lag values, even without appreciating the inherent inaccuracies of many of the figures they’re seeing. Sometimes users will sweat over a few milliseconds difference, the sort of difference that could be accounted for purely by the measurement method’s margin of error. However the figures have been derived, it’s important to appreciate that different people have different tolerances to input lag. Some would much prefer a screen with next to no input lag (<4ms for example) whilst others would happily use a screen with much higher input lag (16ms+). Some will also find the experience absolutely fine as long as the signal delay is low, whereas others prefer the low 'visual latency' from snappy pixel responses as well.
Refresh rate
Fixed refresh rate
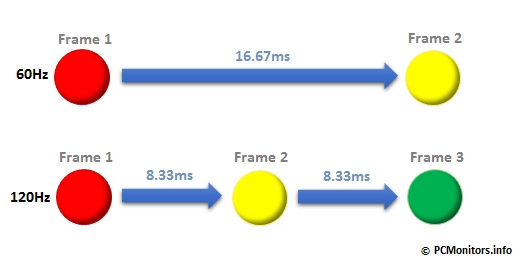
A diagram comparing refresh rates
Variable refresh rate (Nvidia G-SYNC, AMD FreeSync and HDMI 2.1 VRR)

Response time
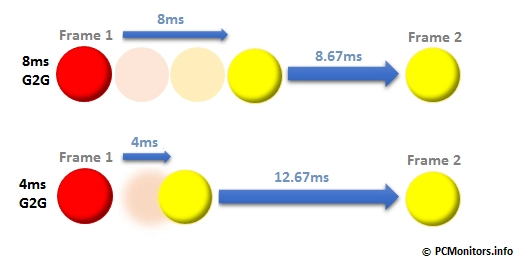
A diagram comparing response times
Overshoot artifacts

Extreme inverse ghosting
Sampling method
Impulse vs sample and hold
A diagram comparing sampling methods
A simple demonstration
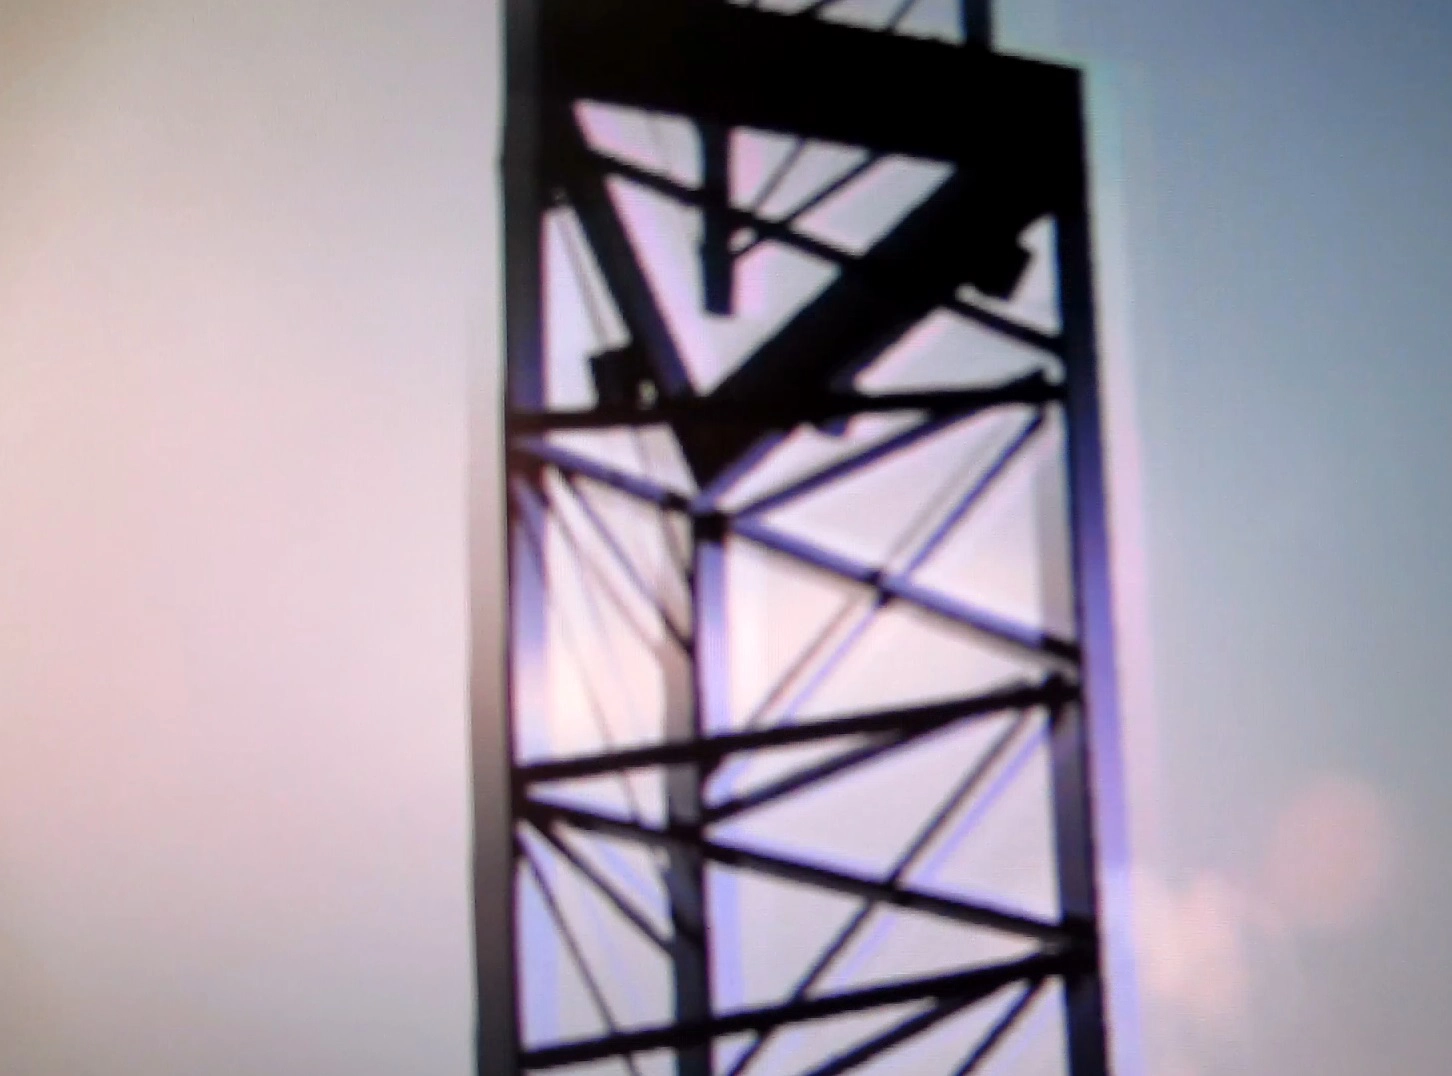
PWM (Pulse Width Modulation usage)
LightBoost and strobe backlights
Introducing strobe backlights
Nvidia LightBoost – for PC users
Nvidia LightBoost
Other PC monitor strobe backlight technologies
Measuring motion blur – strobe vs. sample and hold
The static photography approach

120Hz (sample and hold)

120Hz (strobe, dark-phase)

120Hz (strobe, light-phase)
The numbers approach
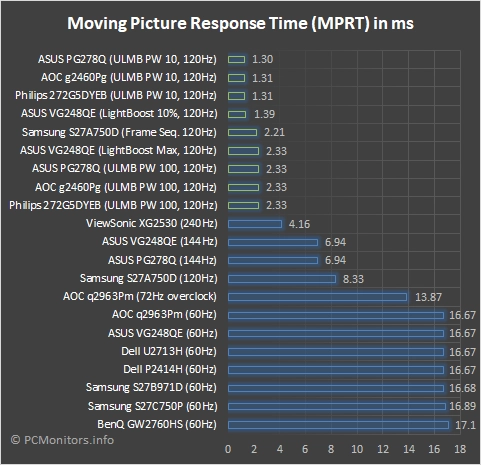
MPRT (Moving Picture Response Time) graph
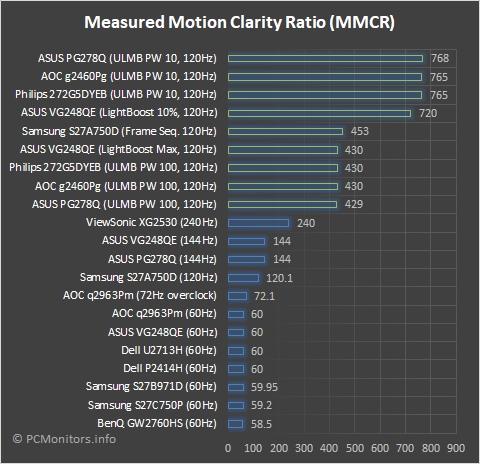
MMCR (Measured Motion Clarity Ratio) graph
MPRT vs. GtG as a benchmark for responsiveness
The pursuit photography approach
Pursuit photographs for various screens and settings
OLED superiority
Conclusion

