Author: Adam Simmons
Date published: August 28th 2018
Table of Contents
Introduction
The vast majority of monitors come with matte anti-glare screen surfaces. Whilst this gives the user more flexibility with their room lighting, it also affects the light emitted from the monitor itself. For some, the ‘pop’ and purity of the image on a glossy screen is very attractive indeed. The Dell S2419H stays true to other relatively recent ~24” offerings from the S Series, including the popular S2415H. It offers a glossy ~24” IPS-type panel with a simple design and affordable price tag. We put this monitor through its paces to see how it performs in a range of ‘real-world’ testing scenarios, including games and movies.
Specifications
This monitor features a 60Hz 27” IPS-type (In-Plane Switching or similar) panel. The monitor supports 8-bit colour via 6-bit + FRC dithering, with a Full HD resolution at 60Hz. A 5ms grey to grey response time is specified, which should always be approached with caution. Some key ‘talking points’ of the specification have been highlighted in blue below, for your reading convenience.
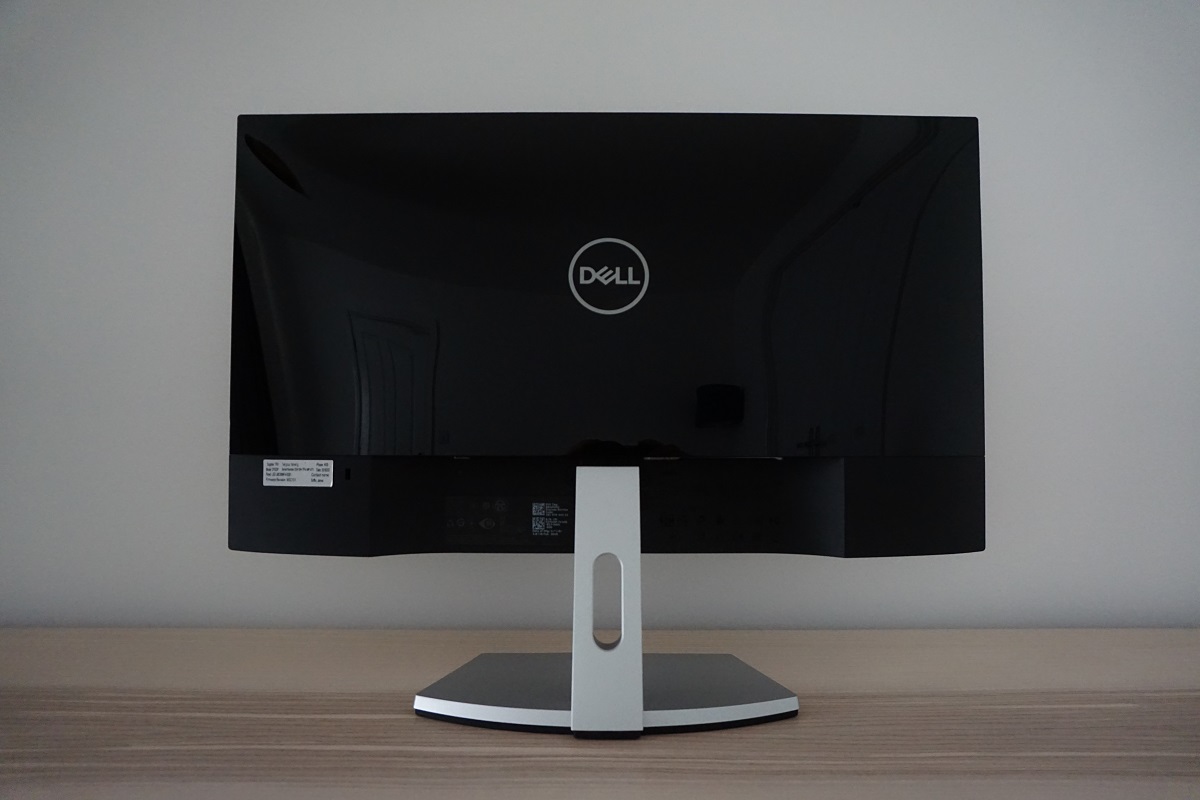
The monitor has a modern homely look, with the now common dual-stage bezels (InfinityEdge as Dell refers to it). These comprise a slim panel border surrounding the image as well as a very slender hard plastic outer component. The bezels remain slim at all sides and including both components measure; ~5mm (0.20 inches) at the top and sides and ~9mm (0.35 inches) at the bottom (~19mm or 0.75 inches if you measure to the bottom of the diagonal sloped section, further back). The key feature from the front is really the 23.8” glossy screen, which employs a very mild anti-glare treatment as explored later. The OSD (On Screen Display) is controlled by pressable buttons on the underside of the bottom bezel, towards the right. There is also a vertical slit-style power LED integrated into the power button, which glows a gentle white when the monitor is on and pulses white when in a low power state (signal to the PC is lost). The video below gives a run-through of the OSD menu system. From the side the monitor is slender – ~13mm (0.51 inches) at thinnest point but lumping out a bit more centrally. The monitor is ~148mm (5.83 inches) deep including the stand, with the bottom edge sitting ~100mm (3.94 inches) and the top edge ~416mm (16.38 inches) above the desk surface. The included stand is silver semi-matte (satin effect) plastic and attaches near the centre and offers tilt (5° forwards, 21° backwards) as the only ergonomic flexibility. There is no provision for VESA mounting. The rear is largely composed of glossy black plastic, with a silver-coloured Dell logo in the middle and matte black plastic used towards the bottom surrounding the port area. The ports are down-firing and include; DC power input (external power brick), 2 HDMI 1.4 ports and a 3.5mm audio output. There is also a cable-tidy loop towards the bottom of the stand neck. The monitor includes 2 x 5W Waves MaxxAudio speakers. The sound from these speakers is certainly not the fullest or most bass-rich sound you will hear nor does it have the crispest and clearest trebles. Indeed, a decent pair of headphones or good standalone speakers can deliver more. However; these speakers still offer significantly richer sound output than most integrated speaker solutions. Particularly for a monitor of this size. They’re certainly usable and will be enough to convince some users to use them in place of dedicated speakers – especially if desk space is at a premium and headphones don’t the sort of sound output you’re after. The image below is a macro photograph taken on Notepad with ClearType disabled. The letters ‘PCM’ are typed out to help highlight any potential text rendering issues related to unusual subpixel structure, whilst the white space more clearly shows the actual subpixel layout alongside a rough indication of screen surface. The monitor uses a glossy screen surface with very mild (low-haze) anti-glare treatment. This cuts down on reflection a bit compared to an untreated glossy screen surface, making reflections somewhat softer and darker than they otherwise would be. It also helps the monitor maintain good clarity and vibrancy compared to a matte (significantly higher haze value) screen surface. You need to be careful with your room lighting to minimise unwanted reflections, but with this appropriately controlled the relatively direct emission of light from the monitor and perceived vibrancy benefits can be enjoyed. Lighter shades appear smooth rather than ‘grainy’ as on some matte surfaces, whilst ambient light striking the screen surface gives a ‘wet look’ to the image with content appearing very close to the outer layers of the screen surface. The Dell S2419H offers a variety of ‘Preset Modes’: ‘Standard’, ‘ComfortView’, ‘Movie’, ‘Game’, ‘Warm’, ‘Cool’ and ‘Custom Color’. The table below shows key readings taken using a Datacolor Spyder5ELITE colorimeter alongside general observations, using some of these presets. Some extra settings available on some presets but not others are also listed. Here we test the presets that we deem more useful and interesting. This, naturally, excludes the ‘Movie’ and ‘Cool’ settings which both give an obnoxiously cool-tone (high white point) as typical for such settings. The monitor was left in its ‘Plug and Play’ state without additional drivers or ICC profiles specifically loaded and was left to run for over 2 hours prior to readings being taken. It was connected to an Nvidia GTX 1080 Ti using the included HDMI cable, on a system running Windows 10. Unless otherwise stated, assume default settings were used except for ‘Dynamic Contrast’ being disabled for the ‘Game’ setting (where it is enabled by default). An important correction was made in the graphics driver to ensure that the correct ‘Full Range RGB’ colour signal was used. The monitor faired better than many using a ‘Limited Range RGB’ signal as the image didn’t look completely washed out, although contrast and overall richness did still suffer. There is guidance on the corrections that need to be made as either an Nvidia or AMD GPU user in this article. When viewing the figures in this table, note that for most PC users ‘6500K’ for white point and ‘2.2’ for gamma are good targets to aim for.
As an Amazon Associate I earn from qualifying purchases made using the below link. Where possible, you’ll be redirected to your nearest store. Further information on supporting our work.

Features and aesthetics


Calibration
Subpixel layout and screen surface
![]()
As shown in the image above, the monitor uses the standard RGB (Red, Green and Blue) stripe subpixel layout. This is the default expected by modern operating systems such as Microsoft Windows and Apple MacOS. You needn’t worry about text fringing from non-standard subpixel layouts as a Mac user and don’t need to run ClearType as a Windows user – although you may wish to adjust this according to preferences. The subpixel layout and arrangement is quite normal and we had no subpixel-related concerns related to sharpness or text clarity on this model.
Testing the presets
Preset Mode Gamma (central average) White point (kelvins) Extra OSD features Notes Standard (Factory Defaults) 2.3 6241K Quite a rich, natural look overall with a slightly warm look but reasonable overall balance. Good depth and ‘pop’ to some shades, with a given shade appearing much the same regardless of where on the screen it appears (i.e. strong consistency). ComfortView 2.3 4975K An effective Low Blue Light (LBL) setting, giving a warm tint to the image. There is a mild green push, but nothing extreme and something our eyes readily corrected for. This setting weakens the strength of the blue colour channel considerably and significantly reduces blue light output from the monitor (especially when combined with reduced brightness). Game 2.3 6243K Hue, Saturation, Dynamic Contrast As factory defaults but additional options available in the OSD. Warm 2.3 5505K An alternative, somewhat less effective LBL setting for those who found the change to the image appearance with ‘ComfortView’ too extreme. Still appears significantly warmer than factory defaults and blue light output is moderately reduced. Test Settings (see below) 2.3 6516K RGB controls Similar to factory defaults but white point brought in-line with target and brightness reduced. Image appears quite vibrant overall with decent shade depth and variety.
Out of the box the image was quite rich with some good depth and ‘pop’ to shades. It was fairly well-balanced, aside from appearing slightly warm compared to the 6500K target. The monitor does not offer gamma adjustment in the OSD and tracks at ‘2.3’ on average with some deviation from the ‘2.2’ target curve. In practice this gives a little extra depth to the image but doesn’t have a dramatic impact either way. Some users might quite like this extra depth as it gives a touch more ‘pop’ and saturation to some shades. The graph below shows the gamma curve under our ‘Test Settings’. Some users may wish to download our ICC profile which corrected gamma to track the ‘2.2’ curve very closely on our unit. This profile was created using our ‘Test Settings’ but was not used for testing in the review. Instructions on how to apply it and some important limitations to be aware of can be found in this article. Importantly, individual units differ so this profile may not be optimal for all units. Most users will actually quite like the gamma setup of this model and the slight extra depth it gives to the image in places. Users who wish to use the monitor for image editing might want to try our ICC profile, for example, but should really consider their own colorimeter to calibrate and re-calibrate their own unit correctly. As covered in the table, the monitor includes 2 LBL settings. The strongest and most effective of these was the ‘ComfortView’ setting, which significantly lowered white point and blue colour output. This is useful to reduce exposure to blue light, for example in the hours leading up to bed. Blue light affects sleep hormones and puts the body in an ‘alert state’, so exposure to it should be reduced in the hours leading up to bed. We used this setting for our own viewing comfort in the evening, although not for testing in the review beyond that focused on this specific setting. We also appreciated how easy it was to enable and disable this setting as it is accessed using the first OSD button (whose function can be customised as a ‘Shortcut Key’. If you frequently activate and deactivate this setting but don’t do much else with the OSD, you could even assign this to ‘Shortcut Key 1’ and your regular settings to ‘Shortcut Key 2’ for convenience. Our ‘Test Settings’ involved a slight reduction in brightness and some minor colour channel corrections. Plus correcting the colour signal as detailed earlier, which is a graphics driver rather than monitor OSD setting. Be aware that individual units and preferences vary, so these settings are only to be considered a guide which will not be optimal in all cases. Any settings not mentioned below, including contrast, were left at default. We have also included the preferred ‘Response Time’ setting used in the review, for reference. R= 97 G= 100 B= 100 Brightness= 60 (according to preferences and lighting) Response Time= Normal We used a BasICColor SQUID3 (X-Rite i1Display Pro) to measure the luminance of black and white using various settings. From these values, static contrast ratios were calculated. This data is presented in the table below. Blue highlights indicate the results under our ‘Test Settings’. Black highlights indicate the highest white luminance, lowest black luminance and highest contrast ratio recorded. Assume that any settings not mentioned here were left at default, with the exceptions already noted in the calibration section.

Gamma 'Test Settings'
Test Settings
Preset Mode = Custom Color
Contrast and brightness
Contrast ratios
Monitor Profile White luminance (cd/m²) Black luminance (cd/m²) Contrast ratio (x:1) 100% brightness 256 0.23 1113 80% brightness 215 0.19 1132 60% brightness 170 0.15 1133 40% brightness 121 0.11 1100 20% brightness 72 0.06 1200 0% brightness 23 0.02 1150 75% brightness (Factory Defaults) 206 0.18 1144 ComfortView 166 0.15 1107 Game 207 0.18 1150 Warm 194 0.18 1078 Test Settings 167 0.15 1113
With brightness only adjusted, the average contrast recorded was 1138:1. This is pleasing for the panel type. The peak contrast ratio recorded was 1200:1. Contrast remained relatively strong following the adjustments made to our ‘Test Settings’, at 1113:1. The Low Blue Light (LBL) settings had minimal impact on contrast, too, with ratios of 1078:1 and 1107:1 maintained for ‘Warm’ and ‘ComfortView’, respectively. The maximum luminance recorded was 256 cd/m², whilst the minimum white luminance was a nice low 23 cd/m². This gives a luminance adjustment range of 233 cd/m². The monitor also has a ‘Dynamic Contrast’ setting which can be enabled in the ‘Movie’ and ‘Game’ presets. This allows backlight brightness to adjust fairly rapidly according to changes in the content on screen. The backlight is controlled as a single Backlight Unit (BLU), so this solution only ever compromises and does not account for intricate mixtures of light and dark. As usual we found it added nothing positive to the experience, just making things overly bright for mixed content and giving obvious and jarring whole-screen luminance changes.
PWM (Pulse Width Modulation)
The Dell S2419H does not use PWM (Pulse Width Modulation) to regulate backlight brightness at any level. DC (Direct Current) is used to regulate backlight brightness, so the monitor is considered ‘flicker-free’. This will come as welcome news to users who are sensitive to flickering or other side-effects of PWM usage.
Luminance uniformity
We observed a black background in a dark room and observed slight backlight bleed towards the corners of the screen. It’s important to note that individual units may vary in this regard. The image below was taken from a couple of metres back to eliminate ‘IPS glow’. This is is a silverish or golden glow (depending on angle) visible from a normal viewing position towards the bottom of the monitor, particularly near the corners. It blooms out more noticeably ‘off-angle’ as demonstrated in the viewing angles video later on. As we explore, it is slightly reduced compared to a comparable monitor with matte screen surface, but is still something of a ‘feature’ on this model. The luminance uniformity of the screen was excellent overall. The brightest point recorded was ‘quadrant 4’ to the left of centre (156.8 cd/m²). The greatest deviation from this occurred at ‘quadrant 9’ towards the bottom right (147.5 cd/m², which is 6% dimmer). The average deviation between the central point and each quadrant was just 1.88%, which is exceptional. Note that individual units vary when it comes to uniformity and there can be further deviation beyond the points measured. The contour map below gives a graphical representation of the deviations. Darker greys represent lower luminance and therefore greater deviation from the central point than lighter greys. The colour temperature deviations for the same 9 quadrants were also analysed using the colorimeter. Deviations here are assigned DeltaE values, with higher values representing greater deviation from the D65 (6500K) daylight white point target than lower values. The contour map below shows these deviations, with stronger shades indicating greater deviation from the 6500K target. A DeltaE of >3 here is considered significant deviation that many users would readily notice by eye. The results here were good, with no significant deviations recorded. As with other aspects of uniformity, it’s important to remember that individual units vary and that there can be deviation beyond the points measured. On Battlefield 1 (BF1) the monitor put in a good contrast performance overall. Some detail was lost when observing dark areas due to ‘IPS glow’, particularly noticeable towards the bottom corners of the screen from a normal viewing position. This created a bit of a ‘haze’ which drowned out subtle detail and lightened up dark shades. This was reduced slightly compared to matte screen surface due to reduced internal reflection, but we wouldn’t describe this as a ‘low glow panel’. The majority of the screen was not affected by this glow, though, and detail levels were good with even fairly subtle details such as interior brickwork visible in dark areas. In brighter lighting conditions the ‘IPS glow’ is not obvious. And with some ambient light striking the glossy screen, perceived contrast is enhanced with things looking quite rich with good ‘pop’. Brighter elements such as flames and flashlights stood out nicely against darker surroundings, appearing smooth and ‘pure’ thanks to the smooth and glossy screen surface. Contrast performance was also relatively good on Dirt Rally. This game has some truly deep and dark night scenes, exposing weaknesses in contrast performance clearly. You could certainly see ‘IPS glow’ take hold towards the bottom corners in particular. And the overall atmosphere in more central regions even was simply not the same as on a VA model with much stronger contrast. But the monitor still provided nice contrast between bright and dark elements, with bright elements such as car headlights standing out well against darker surroundings. These had good ‘pop’ to them as well as a nice smoothness thanks to the screen surface. We also observed the Blu-ray of Star Wars: The Force Awakens. This title has a lot of high-contrast scenes with bright elements (light sabers, explosions) lighting up surrounding darkness (the lonely depths of space or suspiciously dark interior locations). The masses of dark didn’t have the same cinematic look as on a monitor with much stronger contrast, although perceived contrast in a brighter room with some light striking the screen surface was good. The screen surface also helped give nice ‘pop’ to the brighter elements, without an annoying haze or grainy quality. The Lagom tests for contrast allow specific weaknesses in contrast performance to be identified. The following observations were made. The Dell S2419H’s colour gamut (red triangle) was compared to the sRGB reference colour space (green triangle), as shown below. Here you can see that the monitor fully covers the sRGB colour space (100%) with just a bit of extension beyond this in the green and red regions of the diagram. This gives the monitor the potential to accurately output all shades within the sRGB colour space, with a little extra vibrancy in places. For the intended purposes of this monitor this works well, especially when combined with the gamma setup. It also means the monitor will respond well to calibration if strong sRGB colour accuracy is desired. On Battlefield 1 (BF1) the monitor presented colours in a rich, natural and varied way. The gamma handling and slight extension beyond sRGB invited just a bit of extra vibrancy, with the screen surface aiding vibrancy potential as well. The environments appeared natural and much as they should, with a pleasing array of earthy browns and dusty Khaki colours. Alongside some nice rich green shades and a pleasing palette of slightly to very muted greens. Fires and explosions had a nice warming and vibrant-looking glow to them. Not as strongly saturated as on models with a more generous colour gamut, naturally, but still nicely saturated with good ‘pop’. The screen surface gave these elements a ‘wet’ look in the right lighting which some users will really appreciate. The consistency of shades was also strong, aiding the subtle variations displayed. A given shade appeared much the same regardless of on-screen position. On Dirt Rally we’d also describe the colour output as rich and varied. The car liveries and advertising around the track showcased some fairly vibrant shades, such as shocking neon pinks and deep purples. These had a ‘wet’ or ‘painted on’ appearance thanks to the screen surface and had respectable but not extreme saturation. The racing environments appeared much as they should, natural with suitable variety and a fair reflection of their real-world counterparts. Earthy browns and muted pastel browns and greens appeared appropriately muted compared to some of the richer shades. Some of the forest greens weren’t as lush and vibrant as you’d see on models with a more generous colour gamut, but were far from appearing ‘washed out’. Finally, we made some observations using the Blu-ray of Futurama: Into the Wild Green Yonder. This is an excellent film to expose strengths and weaknesses in colour consistency, with large blocks of individual shade helping weaknesses here stand out in a very obvious way. The monitor performed well in this respect. There was no obvious shift in saturation at different points in the screen, as you’d get with VA and moreover TN models. This also helped the monitor produce a nice variety of subtle shade variation, noticeable on character skin-tones for example. With each character having its correct ‘skin tone identity’ regardless of on-screen position. There were some nice deep and vibrant shades on this film as well, with particularly nice ‘pop’ to some of the neon greens and pinks. Especially when surrounded by darker shades and a bit of ambient light was striking the screen surface. Lagom’s tests for viewing angle tests were used to further explore colour consistency and viewing angle performance. The following observations were made from a normal viewing position, eyes around 70cm from the screen. On some monitors, particularly but not exclusively those with high refresh rates, interlace patterns can be seen during certain transitions. We refer to these as ‘interlace pattern artifacts’ but some users refer to them as ‘inversion artifacts’ and others as ‘scan lines’. They may appear as an interference pattern or mesh or interlaced lines which break up a given shade into a darker and lighter version of what is intended. They often catch the eye due to their dynamic nature, on models where they manifest themselves in this way. We did not observe any such ‘interlace pattern artifacts’ on this model. Some models display static interlace patterns, not linked to motion and observed when the monitor is simply displaying a static image as well. Some shades may appear as faint horizontal bands of a slightly lighter and slightly darker version of the intended shade. We did observe static interlace patterns on this model, with some light and medium blue, yellow and orange shades in particular showing this. The horizontal bands were reasonably faint and not everyone would notice or find them bothersome. Curiously, if you reduced the refresh rate to 50Hz they became even more faint. Increasing the refresh rate much beyond 60Hz (refer to a note on ‘overclocking’ in the next section) made these extremely obvious. A utility called SMTT 2.0 was used alongside a sensitive camera to compare the latency of the Dell S2419H with various monitors of known input lag. We took over 30 repeat readings to maximise accuracy. Using this method, we measured 2.93ms (under 1/5 of a frame at 60Hz) of input lag. This value is influenced both by the element of input lag that you see (pixel responsiveness) and that which you feel (signal delay). It indicates a very low signal delay that even sensitive users shouldn’t find bothersome. In our responsiveness article we explore the factors influencing monitor responsiveness. One of the key concepts explored is ‘perceived blur’, caused predominantly by eye movement as motion is followed on a screen. Pixel responsiveness also contributes to this. We also explore a technique called ‘pursuit photography’, which uses a moving rather than stationary camera to capture motion in a way that reflects both eye (camera) movement and pixel responsiveness. The images below are pursuit photographs taken using the UFO Motion Test for ghosting, with the test running at the default speed of 960 pixels per second and the monitor set to 60Hz. This is a good practical speed for such photography, highlighting the key elements of perceived blur nicely. The UFO moves across the screen from left to right at a frame rate matching the refresh rate of the display. All background shade levels (dark, medium and light) were used and all three ‘Response Time’ settings tested; ‘Normal,’ Fast’ and ‘Super Fast’. The final image shows a reference monitor (Dell S2417DG), running at 60Hz and giving an indication of how things should look where pixel responsiveness isn’t really a limiting factor. Note that we will not be including a section on overclocking. The monitor could be set to 71Hz using CVT Reduced Blank timing (66Hz with standard timing), above which it simply lost signal and refused to display an image. The interlace pattern artifacts noted earlier were very obvious at this refresh rate, however. On Battlefield 1 (BF1) the monitor provided a decent 60Hz performance overall. There was a moderate degree of perceived blur, particularly noticeable when moving your character relatively quickly such as performing snappy mouse movements. This was caused predominantly by eye movement – so, in other words, linked to the 60Hz refresh rate and something that would apply to even the fastest 60Hz LCDs. There were some weaknesses in pixel responsiveness in places, however. There was a touch of ‘powdery’ trailing in places, which was generally very light and added only slightly to overall perceived blur. Some of the slightly stronger examples of this could be observed for higher contrast transitions, for example where very light and significantly darker shades moved against one another. A dark wooden hut against a blue sky, for example. The ‘powdery’ trailing here was somewhat ‘heavier’ in appearance (less fine) and therefore added to perceived blur to a greater degree. But it was a far cry from what you’d see on most VA models and was not what we’d describe as ‘smeary’. We made similar observations on Dirt Rally. There was a moderate amount of perceived blur, with the environment becoming noticeable unfocused even during fairly gentle cornering. This was predominantly caused by eye movement and something that would apply equally to even much faster 60Hz monitors. There were some weaknesses, but nothing extreme. When driving at night, for example, some of the slower than optimal transitions were apparent and there was some ‘powdery’ trailing in places. This increased perceived blur in places but was nowhere near as obvious as the ‘smeary’ trailing that some VA models provide. We also made observations using our Blu-ray film test titles and didn’t observe any weaknesses attributable to pixel responsiveness on the monitor. The fluidity of such content is limited by the ~24fps frame rate. Observing 60fps movie content revealed some of the slight weaknesses observed for our in-game testing, which was also performed at 60fps. On both game titles (and other suitably high frame rate content) we also observed a small amount of overshoot in places. Darker trails could be seen behind some bright objects surrounded by darker shades, for example the moon in the night sky. This was restricted to a slim number of transitions and wasn’t universally observed with the moon in the night sky, only when the sky was certain shades. There were also a few brighter trails in places, between medium shades, but these were rather faint and unobtrusive. The responsiveness section of the video review below highlights some of these weaknesses, but also concludes that the monitor performs quite well within the confines of the 60Hz refresh rate. Most users will not find the weaknesses described here bothersome or necessarily even notice them, but it is still important to point them out. The video below summarises some of the key points raised in this written review and shows the monitor in action. The video review is designed to complement the written piece and is not nearly as comprehensive. A lot of focus and buzz currently surrounds HDR (High Dynamic Range) technology, high refresh rates, variable refresh rates and high resolutions. It’s often easy to forget that many users are after something a lot more basic. With its Full HD panel, budget price tag and 60Hz refresh rate, the Dell S2419H offers a simpler experience. The glossy (‘low haze’) panel is quite refreshing in a market dominated by matte anti-glare screen surfaces. It offered some clear (pun intended) benefits to perceived vibrancy and clarity, giving a relatively smooth and ‘pure’ look to the image. It also aided perceived contrast quite handily in the right lighting, although the static contrast of this model was quite good for the panel type anyway. There was ‘IPS glow’ as usual for the panel type, reduced slightly by the screen surface although not what we’d broadly classify as ‘low glow’. This is of course subjective and open to interpretation. Colour reproduction was also pleasing, overall. The ‘out of the box’ performance was quite respectable already, with only slight changes to colour gamut and a slight brightness reduction required. The gamma strayed a bit from the ‘2.2’ target, averaging ‘2.3’ – but some users would quite like the slight extra edge in depth and vividness that this brings. It was not an extreme deviation by any means. The monitor also provided just a bit of extension beyond sRGB, but tracked the gamut quite closely really. It presented colours in a rich and varied way, with some good vibrant ‘pop’ in places aided by the screen surface. The IPS-type panel kept things very consistent, too, and with full calibration with a colorimeter or similar device the monitor would work nicely for colour-critical work on a budget. One thing we did notice, which is by no means exclusive to this model, is static interlace patterns on some solid shades. Not everybody notices this and in our correspondence with users over the users most don’t find it too bothersome. But it would have been nice if it were absent on this model. As far as responsiveness goes the monitor performed reasonably well within the confines of its 60Hz refresh rate. It had very low input lag and pixel responsiveness which was good enough for a decent 60Hz experience. There were some weaknesses in terms of ‘powdery’ trailing and overshoot in places, but nothing extreme nor particularly unusual for the panel type. The monitor wasn’t comfortable running above 60Hz, with the aforementioned interlace patterns becoming far too pronounced and a limit of 71Hz on our unit (66Hz using the standard signal). It also doesn’t support FreeSync, which some models in the price range do. If you consider the feature-set of the monitor, fairly limited port selection and limited ergonomic flexibility – it’s very much a ‘no-frills’ product. But it does offer a solid all-round performance which is difficult to argue with at the price. The basic aesthetic and very slim bezels will also appeal to some users, so it’s definitely a strong contender in the budget Full HD monitor space.

The Spyder5ELITE colorimeter was used to analyse the uniformity of lighter colours, represented by 9 equidistant white quadrants running from the top left to bottom right of the screen. The table below shows the luminance recorded at each quadrant and the deviation between a given quadrant and the brightest quadrant.

Luminance uniformity table

Luminance uniformity map

Colour temperature uniformity map
Contrast in games and movies
Lagom contrast tests
Colour reproduction
Colour gamut

Colour gamut 'Test Settings'
Colour in games and movies
Viewing angles

The following video shows the Lagom text test, a mixed desktop background and dark desktop background from various viewing angles. You can see only minor shifts in contrast and colour presentation from steeper viewing angles, less pronounced than VA and in particular TN panels would show. The dark background reveals the aforementioned ‘IPS glow’, particularly noticeable as it blooms out from steeper angles.
Interlace pattern artifacts
Responsiveness
Input lag
Perceived blur (pursuit photography)

You can see that the UFO appears soft and unfocused in all cases, which reflects a moderate degree of perceived blur due to eye movement. This is closely tied in with the 60Hz refresh rate and appears much the same on the reference screen. There are also various degrees of trailing behind the object, caused by sub-optimal pixel responses. With ‘Response Time’ set to ‘Normal’ there is a slight ‘powdery’ trail behind the object for the dark background. This is there to a lesser extent for the medium background, with a small amount of overshoot (inverse ghosting). This is very faint, but if you look closely you can see a slight bright ‘halo’ tail behind the object. The light background doesn’t really show any conventional trail and again has a small amount of overshoot. The ‘Fast’ setting introduces far more noticeable overshoot, with colourful trailing behind the object in all cases. The ‘Super Fast’ setting intensifies this slightly. From this analysis it is clear that the ‘Normal’ setting is optimal – the overshoot with the ‘Fast’ and ‘Super Fast’ settings stands out in an unmistakable way in practice. Much more so than any weaknesses using the ‘Normal’ setting.
Responsiveness in games and movies
Video review
Timestamps:
Features & Aesthetics
Contrast
Colour reproduction
Responsiveness
Conclusion
The bottom line; a fairly pared-down product in terms of feature-set, but a solid all-round performance at an affordable price.
![]()
Positives Negatives Rich, natural and varied colour output with a glossy (‘low haze’) screen surface helping give some nice ‘pop’ to some shades
No wide gamut support, HDR or similar features and ‘2.3’ gamma on average – full calibration with a colorimeter recommended for colour-critical work Good static contrast for the panel type, a ‘pure’ look to the image with fairly direct light emission and somewhat reduced glow due to the screen surface. Excellent luminance uniformity on our unit, too Still a fair degree of ‘IPS glow’, the glossy screen surface necessitates more careful control of ambient lighting Very low input lag and reasonable pixel responsiveness within the confines of the 60Hz refresh rate
No real overclocking headroom without image quality degradation, slight weaknesses in pixel responsiveness Very slim bezels, a nice shallow stand design and an effective and easy to activate/deactivate Low Blue Light (LBL) setting Very limited ergonomic flexibility and no provision for VESA mounting
As an Amazon Associate I earn from qualifying purchases made using the below link. Where possible, you’ll be redirected to your nearest store. Further information on supporting our work.
