Author: Adam Simmons
Date published: January 17th 2017
Table of Contents
Introduction
When it comes to gaming monitors, the combination of styling, responsiveness, G-SYNC capability and resolution of the Dell S2716DG wins many fans over. With the Dell S2417DG, these attributes have been carried over onto a smaller monitor with lower price tag (region dependent) and superior pixel density. In addition to this, the refresh rate has been boosted slightly, from 144Hz to 165Hz. Although monitor size is very much a personal preference, there are some users who much prefer gaming on ~24” screens to anything larger. This is certainly a compelling gaming monitor on paper, but how does it perform in practice? This is what we shall find out.
Specifications
The monitor uses a 23.8” TN (Twisted Nematic) panel from AU Optronics with support for a refresh rate of up to 165Hz and 8-bit colour support. A 1ms grey to grey response time is specified, which should of course never be taken at face value. Key talking points of the specification have been highlighted in blue below.
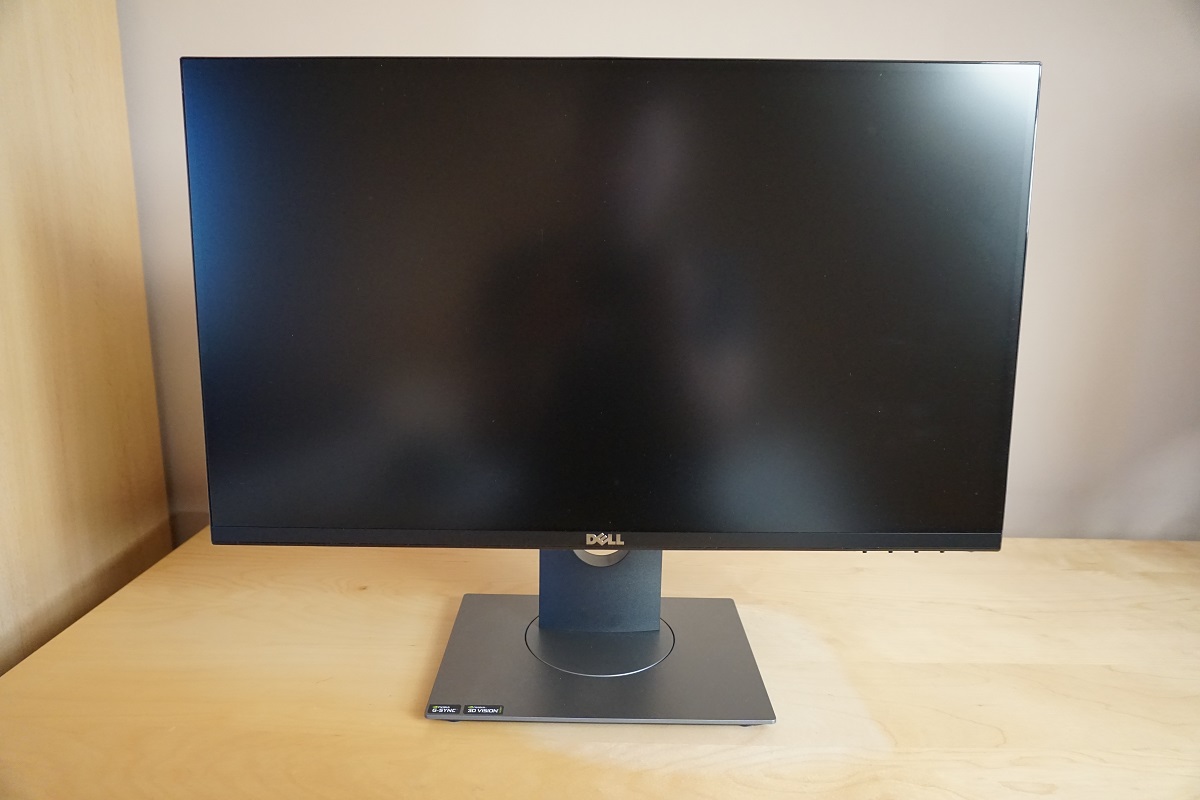
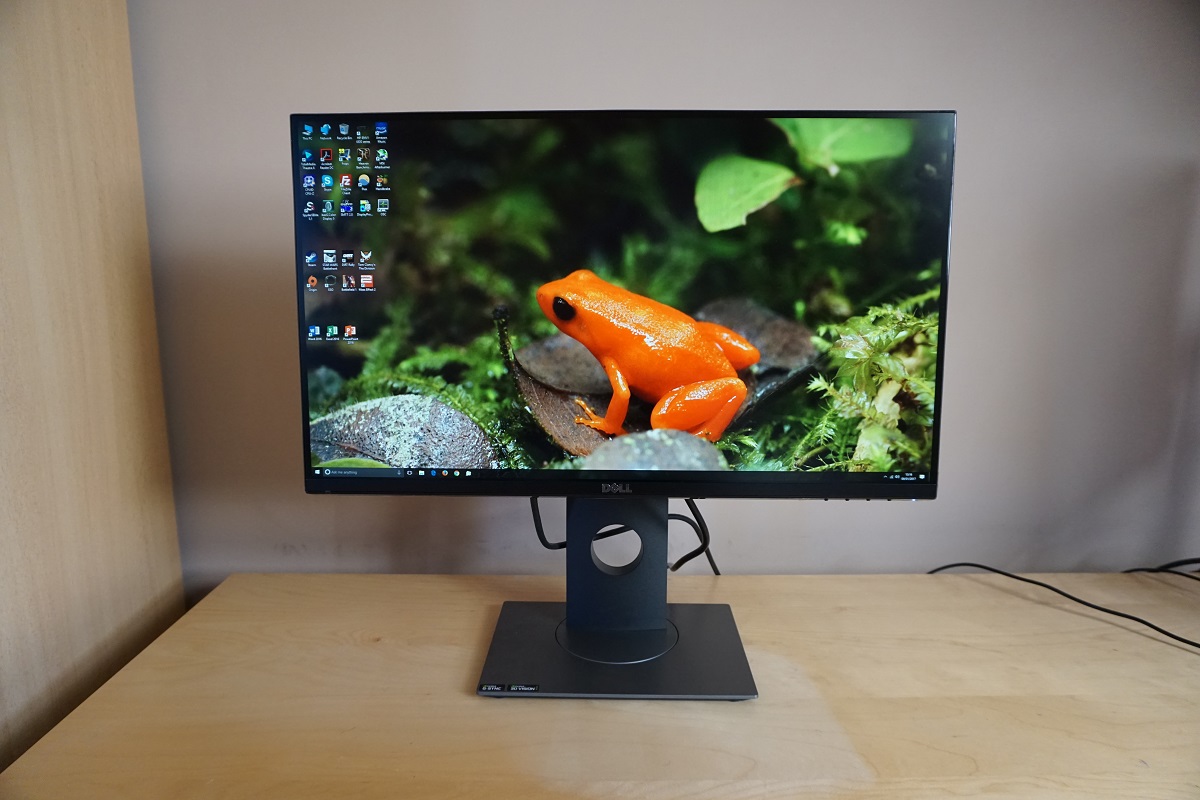
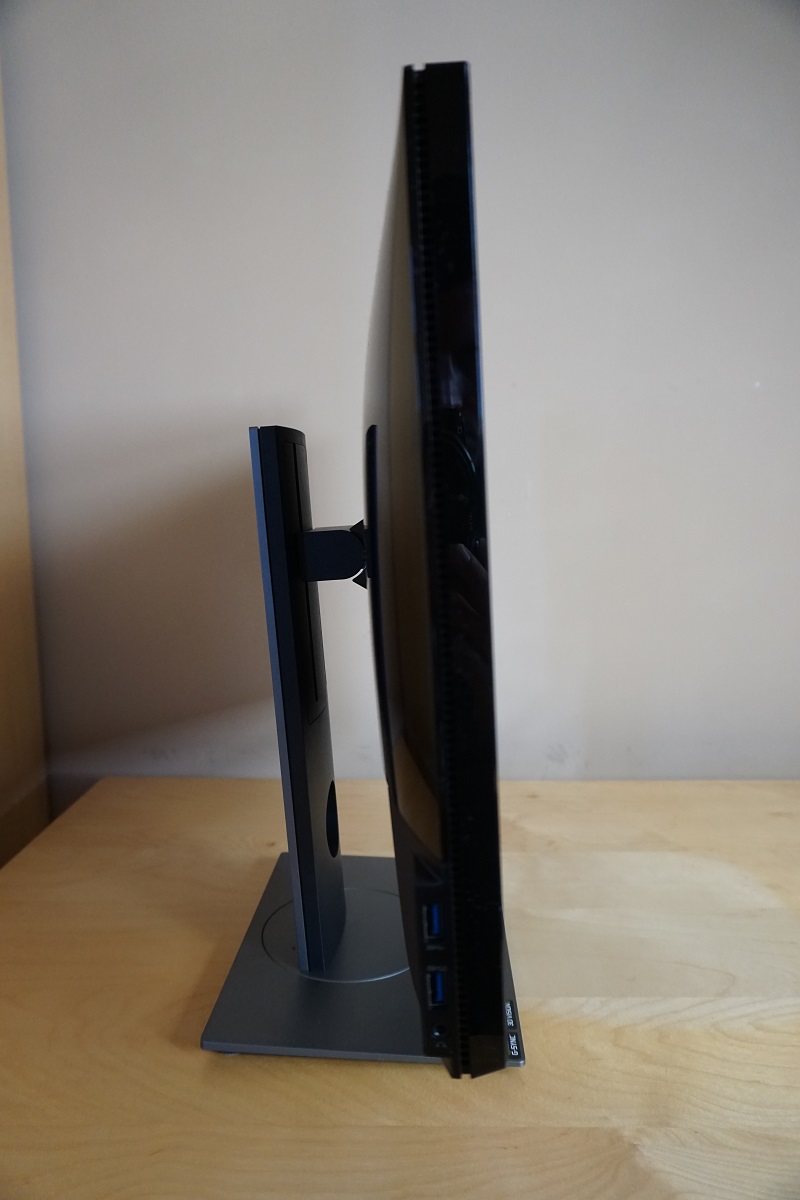
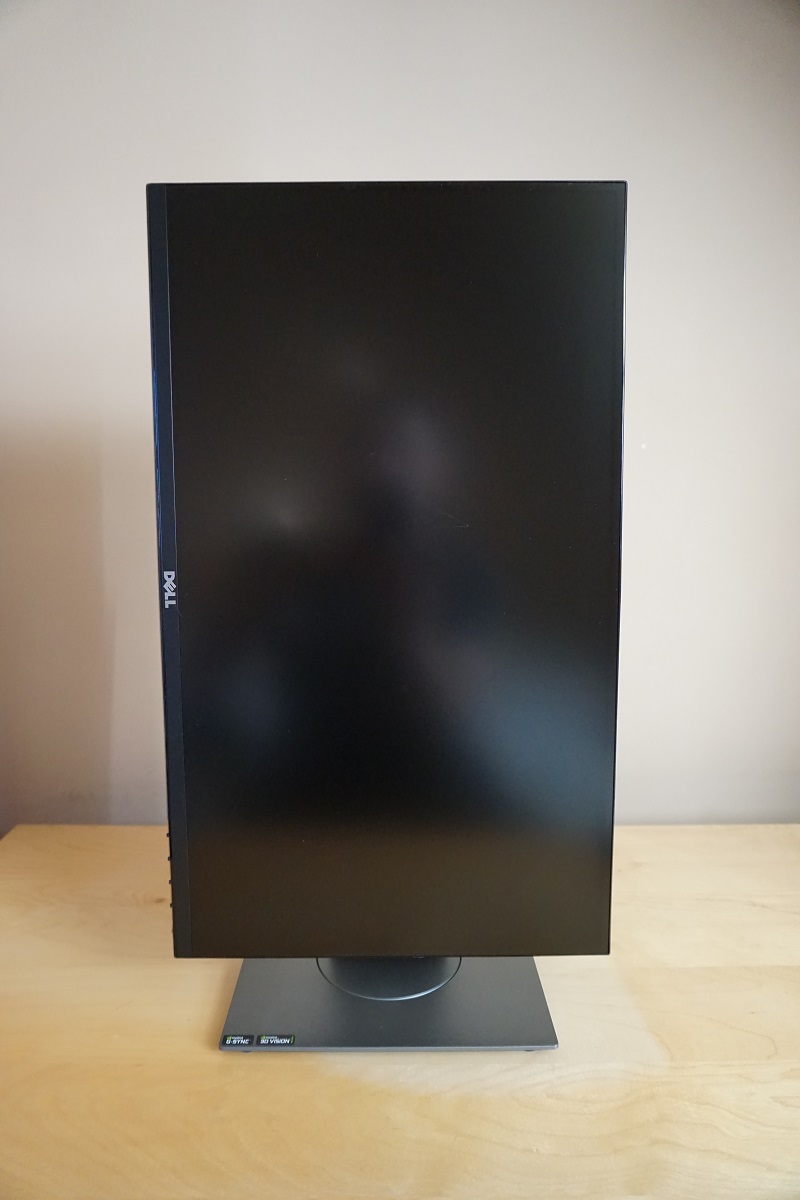
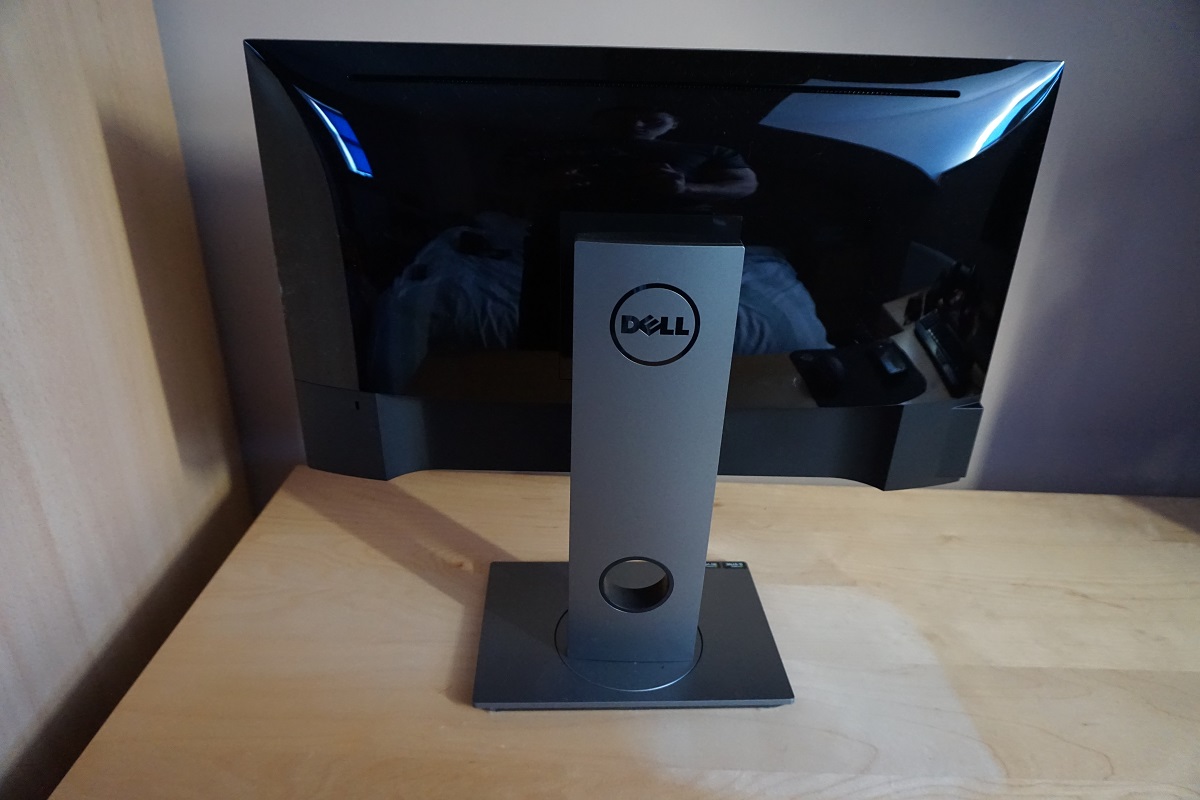
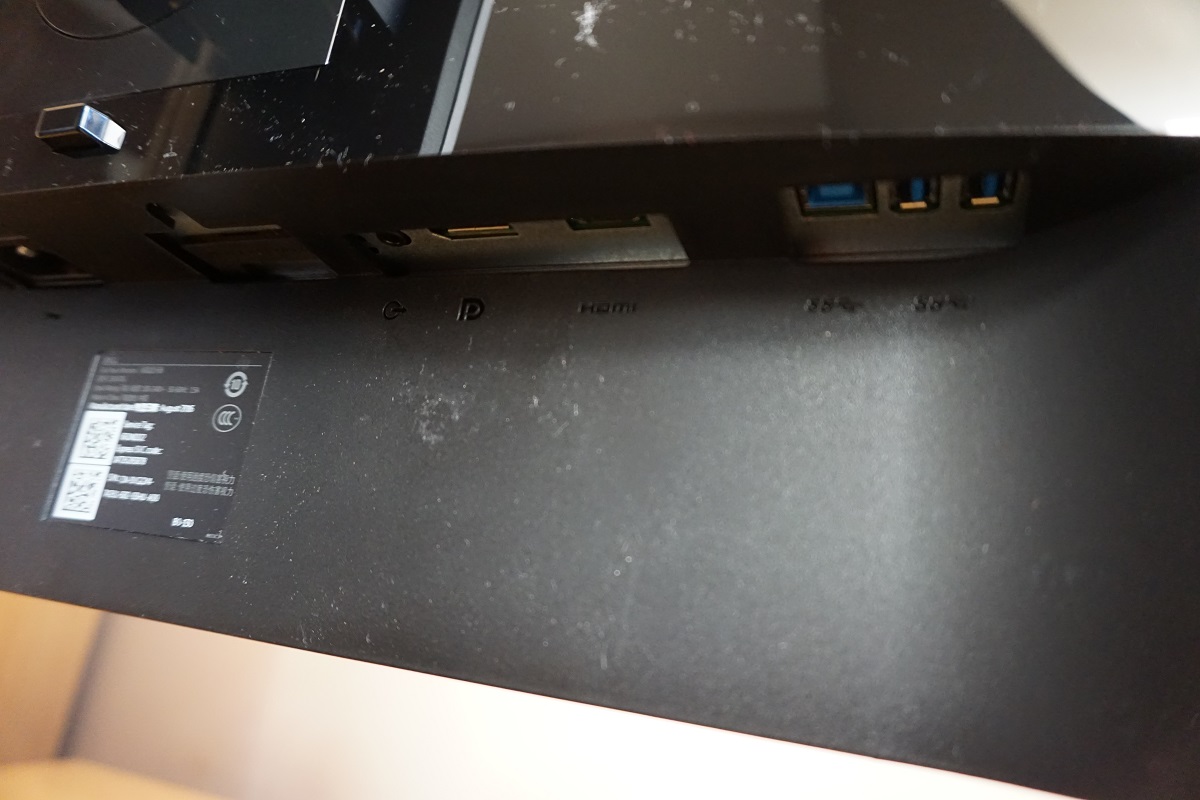
The monitor shares the understated aesthetics of its predecessor, distancing itself from many far more ostentatious gaming offerings. The front features slender ‘dual-stage’ bezels, with a very slim hard outer component and slender panel border visible at the top and sides (and just a sliver at the bottom). The total bezel width, including both components, is ~6.5mm (~0.26 inches) at the top and sides, slightly slimmer than the already svelte bezels of the 27” model. At the front of the monitor the bottom the bezels are ~17.5mm (~0.69 inches) including a sliver of panel border, sloping diagonally downwards and backwards slightly. The stand base is matte silver plastic, with black plastic used on the neck and semi-matte plastic used for the bottom bezel. The screen surface is light matte anti-glare, as explored later. Towards the right of the bottom bezel, facing downwards, are the pressable buttons which control the OSD (On Screen Display) and power state of the monitor. The power LED is found on the power button, a slit running from the centre to front of the button. This glows a cool white when the monitor is on and flashes when it is on standby. Or more specifically when it is in an ‘active-off’ state, which occurs if the signal to the computer is lost with the monitor on and the power button isn’t pressed. If the power button is pressed to turn the monitor ‘off’ then the power LED goes out. The following video gives a run-through of the OSD. The monitor appears quite slender from the side, coming in at around 20mm (0.79 inches) at thinnest point and lumping out more centrally. At the left side of the screen there are 2 USB 3.0 ports (bottom one supports fast-charging) and a 3.5mm headphone jack. The included stand offers good adjustability; tilt (5° forwards, 21° backwards), swivel (45° left, 45° right), height (130mm or 5.12 inches) and pivot (90° clockwise rotation into portrait). The total depth of the monitor including its stand is ~180mm (7.09 inches), which gives it a shallow footprint and allows it to be pushed quite far back even if your desk isn’t particularly deep. The screen itself is just a little bit back from the front stand edge, perhaps 20mm (0.79 inches) or so. The width of the stand base is also far from excessive and again highlights that the design is quite minimalistic for a gaming monitor; ~244mm (~9.61 inches) wide. With the screen at lowest height the bottom of the screen clears the desk by ~49mm (~1.93 inches) with the top of the screen ~365mm (14.37 inches) above the desk. At the rear, black glossy plastic is used throughout, with the exception of the port area where matte black plastic is found and the stand which includes matte black and silver plastic elements. The stand neck also has a loop towards the bottom which can be used as a cable-tidy. A quick-release bracket mechanism is used for stand attachment, allowing the stand to be easily removed. 100 x 100mm VESA holes are found beneath for alternative mounting. There is a Kensington Lock slot towards the left side of the screen, at the rear, whilst the ports found here face downwards. They are, from left to right; AC power input (internal power converter), 3.5mm audio output, DP 1.2a (supports G-SYNC), HDMI 1.4, USB 3.0 upstream and 2 further USB 3.0 downstream ports (4 total). DisplayPort must be used to unleash the full potential of the monitor, including 2560 x 1440 @ 165Hz and G-SYNC functionality. HDMI supports up to 2560 x 1440 @ 60Hz only and is really there for compatibility with alternative systems such as games consoles. AMD GPUs can run the monitor at 165Hz using DP as well, but will not have access to Nvidia-specific features such as G-SYNC. A USB 3.0 cable and DP cable is included in the box. The monitor uses a light matte anti-glare screen surface with a relatively smooth surface texture. This is similar to the surface used on newer revisions of the S2716DG and provides superior clarity and vibrancy potential compared to stronger matte screen surfaces, such as that used on earlier S2716DG revisions and various other 144Hz+ monitors. The screen is free from obvious graininess, even when observing the brightest shades, whilst quite effective glare-handling characteristics are maintained. The usual RGB (Red, Green and Blue) stripe subpixel layout is used, which is the default layout for modern operating systems such as Microsoft Windows and Apple’s MacOS. Mac users therefore don’t need to worry about text fringing from non-standard subpixel layouts and Windows users don’t need to run ClearType. They may still wish to run through the ClearType wizard and adjust according to preferences, however. The monitor offers ‘Preset Modes’; ‘Standard’, ‘FPS Game’, ‘RTS Game’, ‘RPG Game’, ‘Warm’, ‘Cool’ and ‘Custom Colour’. The ‘Custom Color’ preset is particularly useful as it allows you to manually adjust the red, green and blue colour channels. The ‘Game’ presets are a new addition that weren’t found on the S2716DG, but they’re of limited use really as all they seem to do is upset the image by causing varying degrees of oversaturation, crushing shade variety at the high-end. We will not be wasting time looking at these in detail, but will be focusing on some of the other ‘Preset Modes’ which we feel do have good utility. The table below shows key readings (central gamma and white point) taken using a Datacolor Spyder5ELITE colorimeter and also general observations using a range of settings. The monitor was left to run for over 2 hours before these readings were taken and observations made, with the monitor in its ‘Plug and Play’ state. No additional drivers or ICC profiles were loaded, except where explicitly mentioned. An Nvidia GTX 1070 was used with Windows 10 installed on the system. Unless otherwise stated, assume default settings were used with the exceptions being the ‘Optimal OSD settings’, ‘Test Settings’ and ‘Relaxing evening settings’ where various adjustments were made. The monitor was set to 165Hz, although this did not have a significant impact on the observations made here. Where ULMB was tested (at 85Hz, 100Hz and 120Hz), brightness was set to ‘100’.
As an Amazon Associate I earn from qualifying purchases made using the below link. Where possible, you’ll be redirected to your nearest store. Further information on supporting our work.

Features and aesthetics
Calibration
Subpixel layout and screen surface
![]()
Testing the presets
Monitor Settings Gamma (central average) White point (kelvins) Notes Standard (Factory Defaults) 2.1 6656K The image is fairly bright and some shades lack a bit of depth, but not to the extent seen on the S2716DG by default. Overall shade richness is reasonable, although some saturation is lost lower down the screen. This is related to perceived gamma changes that are tied to viewing angle restrictions, which mean that perceived gamma is higher (saturation/depth greater) further up the screen and lower (saturation/depth reduced) further down the screen from a normal viewing position. This is drawback is entirely typical for the TN (Twisted Nematic) panel type. Warm 2.1 5903K As above but the image appears considerably warmer (<6000K). The blue light levels are therefore reduced slightly, although not significantly enough to consider this a ‘Low Blue Light’ (LBL) setting. Custom Color 2.1 5945K As above really, just slightly less warm in appearance. ULMB @ 120Hz 2.1 6577K The screen is now strobing (pulsing its backlight on and off) 120 times a second, giving a mild flickering similar to a 120Hz CRT. Overall colour balance and gamma handling remains quite similar, but the image is significantly dimmer than factory defaults even at ‘100’ brightness – some users will find this fine, others would prefer a brighter image. ULMB @ 100Hz 2.1 6586K As above but flickering a bit more noticeable due to the strobe frequency of 100Hz. The image appears marginally brighter as well. ULMB @ 85Hz 2.1 6586K As above, but flickering is now very obvious to us due to 85Hz strobing. We find this uncomfortable to use for prolonged periods, but not everyone would find it as bothersome. The image appears somewhat brighter. Optimal OSD settings (see below) 2.1 6497K The brightness has been lowered to more comfortable levels and some tweaks made to the RGB channels to help achieve very close to the 6500K white point target. Some shades still appear a bit lighter than they should, but this is more subtle than on the 27” version (as indeed the gamma averages ‘2.1’ not ‘1.9’). Test Settings (ICC profile applied, see below) 2.2 6495K An ICC profile has been applied over the ‘Optimal OSD settings’. Gamma is now corrected to conform to the ‘2.2’ curve, which improves the depth and saturation of some shades. The image appears rich and varied overall, but the variations described earlier related to viewing angles still apply. Relaxing evening viewing (ICC profile applied, see below) 2.2 4050K This uses an ICC profile we created on top of the ‘Optimal OSD settings’ which targets a low ~4000K white point. As a result, blue light output from the monitor is significantly reduced – beneficial for relaxing evening viewing. This is sort of like using F.lux or a ‘Low Blue Light’ mode, but it maintains specific corrections of the ICC profile (including gamma corrections) as well as lowering white point.
Straight from the box the monitor was fairly bright, although not overwhelmingly so. Some shades appeared a bit lighter than they should due to the average gamma, but appeared quite rich overall. Vastly superior to many 144Hz+ models and a fair bit richer than the S2716DG appeared out of the box, too. Following tweaking in the OSD which we deemed optimal (‘Optimal OSD settings’) the gamma handling remained very similar – the gamma curve is shown in the top image. To help improve the saturation levels and lift some of the shades up a bit, an ICC profile was applied on top of these ‘Optimal OSD Settings’ to form our ‘Test Settings’. The bottom image shows this, with gamma now conforming very closely to the ‘2.2’ curve. Although the monitor included a ‘Warm’ preset, which lowered the white point a bit and provided a slightly warmer-looking image, this didn’t really take things far enough to be considered a ‘Low Blue Light’ (LBL) setting. We therefore created an alternative ICC profile which applies all relevant corrections but targets a white point of ~4000K rather than ~6500K. This significantly reduces the strength of the blue colour channel and reduces blue light output from the monitor, making it suitable for relaxing evening viewing; hence we refer to these are ‘Relaxing evening viewing’ settings. There are no gamma settings in the OSD and no real way to adjust the gamma curve of the monitor without significantly upsetting the image in other ways. It was therefore not possible to get any closer than ‘2.1’ on average for the gamma, which isn’t bad really but also not quite where you’d ideally want to be. The brightness was reduced to more comfortable levels for our preferences and lighting environment and some changes made to colour channels in the ‘Custom Color’ preset, to achieve close to the 6500K target. Note that individual units vary and these should only be used as a guide and may not necessarily be optimal for all units. Any setting not mentioned here, including contrast, was left at default. We’ve included the ‘Response Time’ setting and refresh rate used in Windows as well, just for reference. Response Time= Normal Preset Mode= Custom Color R= 100 G= 93 B= 93 Refresh rate= 165Hz We created an ICC profile with a Spyder5ELITE colorimeter, using the ‘Optimal OSD settings’ above as a base. The gamma adjustment is really the key change made here, to help slightly improve the richness of some shades. The ICC profile is specific to our unit, but the gamma behaviour of these monitors is generally quite predictable so it should at least improve that aspect quite reliably. It can also be combined with whatever brightness or colour channel adjustments you require – as long as they aren’t too extreme, the improvement to gamma should remain. To make use of our profile do the following: As noted above we created an additional ICC profile that acts as a ‘Low Blue Light’ (LBL) mode whilst also applying further corrections, including to gamma. Simply follow the instructions above, but instead apply our LBL profile. This is again designed to be used in conjunction with the ‘Optimal OSD settings’, although further adjustments can be made if desired. We would recommend making use of the ‘Display Profile’ utility mentioned at the bottom of our ICC article as well as it makes it a lot easier to quickly activate and de-active this profile. White and black luminance levels using a range of settings on the monitor were accurately measured using a BasICColor SQUID 3 (X-Rite i1DisplayPro). The table below shows this data, with blue highlights indicating results under the ‘Optimal OSD settings’, ‘Test Settings’ and ‘Relaxing evening viewing’ settings. Black highlights indicate the highest white luminance, lowest black luminance and maximum contrast ratio recorded. Assume that any setting not mentioned here was left at default, with exceptions mentioned in the calibration section.
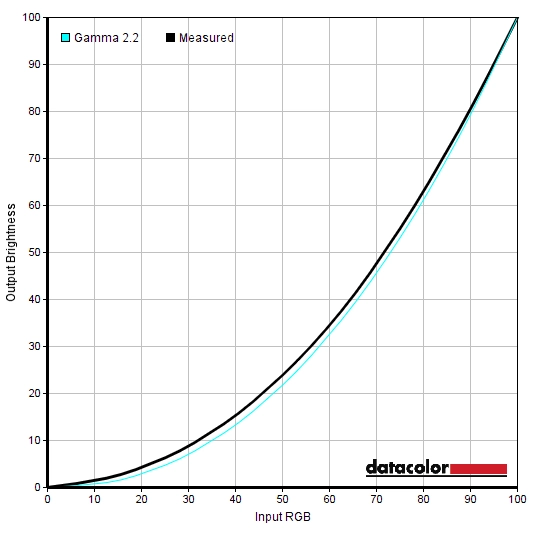
Gamma 'Optimal OSD settings'
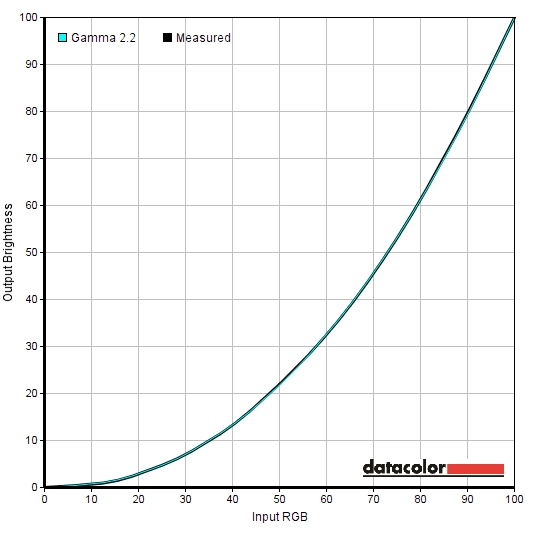
Gamma 'Test Settings'
Optimal OSD settings
Brightness= 58 (according to preferences and lighting)
Test Settings (ICC profile)
2) Set the monitor up according to the ‘Optimal ‘OSD settings’, although further adjustments can be made if desired. Using a brightness of ‘58’ provided 160 cd/m² on our unit with the ICC profile applied.
3) This article provides instructions on activating the profile as well as some limitations to be aware of when gaming in particular. Games do generally respond to the profile or at least apply the gamma correction – plus the image is fairly rich even without the profile active.
Relaxing evening viewing (ICC profile)
Contrast and brightness
Contrast ratios
Monitor Settings White luminance (cd/m²) Black luminance (cd/m²) Contrast ratio (x:1) 100% brightness 398 0.49 813 80% brightness (Factory Defaults) 248 0.31 800 60% brightness 176 0.21 838 40% brightness 130 0.16 813 20% brightness 83 0.10 830 0% brightness 35 0.04 875 Standard (Factory Defaults) 209 0.25 836 Warm 228 0.25 836 Custom Color 235 0.25 940 ULMB @ 120Hz 149 0.20 745 ULMB @ 100Hz 158 0.21 752 ULMB @ 85Hz 186 0.25 744 Optimal OSD settings 169 0.20 845 Test Settings (ICC profile) 170 0.20 850 Relaxing evening viewing (ICC profile) 120 0.20 600
The average static contrast was 821:1, with only brightness adjusted. This falls a little short of the specified 1000:1, but the difference in perceived contrast is hardly profound. The maximum contrast was obtained in ‘Custom Color’ with all colour channels in their neutral position of ‘100’ – at 940:1, it’s fairly close to the specified 1000:1. With the adjustments made to our ‘Optimal OSD settings’ and for our ‘Test Settings’ (ICC profile applied on top) static contrast was 850:1 which is reasonable. This dropped to 600:1 following application of our ‘Relaxing evening viewing’ profile, which made significant colour channel adjustments. The contrast dropped a little with ULMB active as well, although a more modest drop to around 750:1. The highest luminance recorded on this table was a bright 398 cd/m² and the lowest white luminance a rather dim 35 cd/m². This yielded an impressive luminance adjustment range of 363 cd/m².
PWM (Pulse Width Modulation)
The monitor does not use PWM (Pulse Width Modulation) and instead uses DC (Direct Current) dimming at all brightness settings. This means the backlight is classed as ‘flicker-free’, which will come as welcome news to those sensitive to flickering or other side-effects from PWM usage. The monitor is not ‘flicker-free’ when ULMB is active, as the whole operating principle of strobe backlight solutions such as this involves flickering. The nature of this flickering is different to that induced by PWM, though, so sensitivity to PWM flickering doesn’t necessarily mean ULMB will be considered problematic.
Luminance uniformity
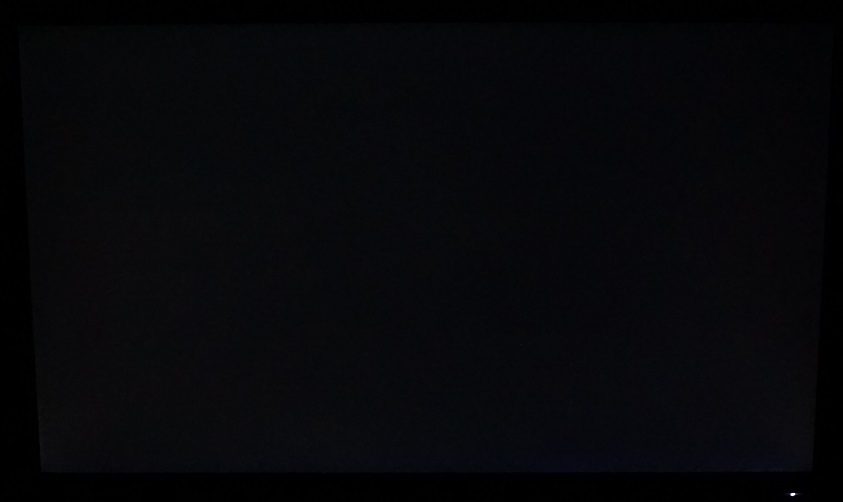
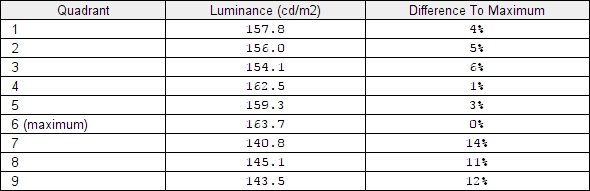
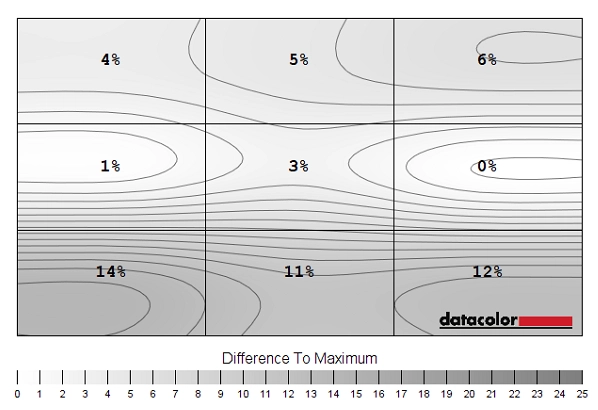
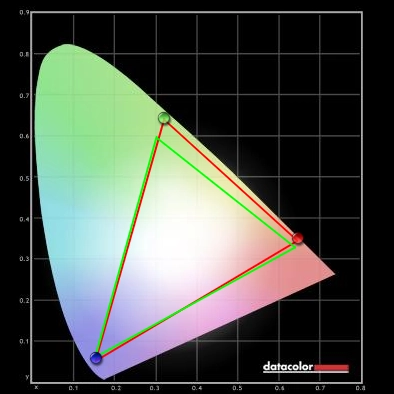
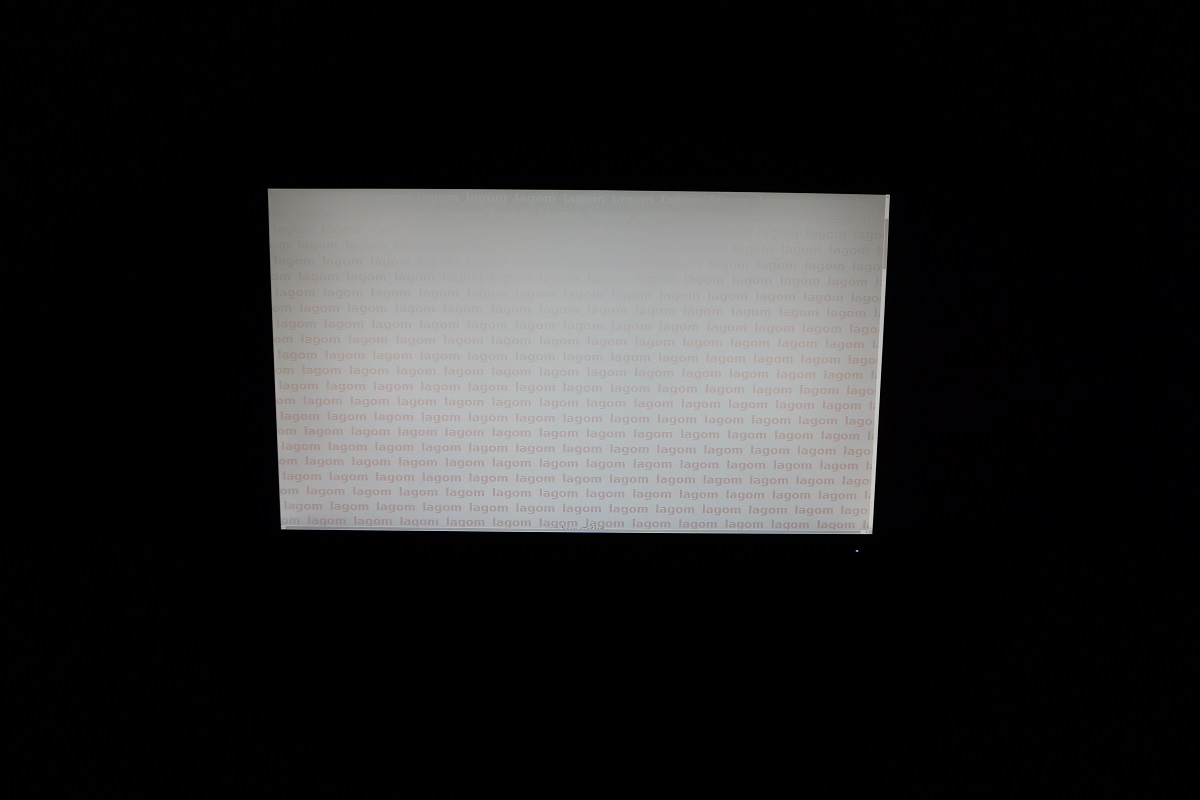
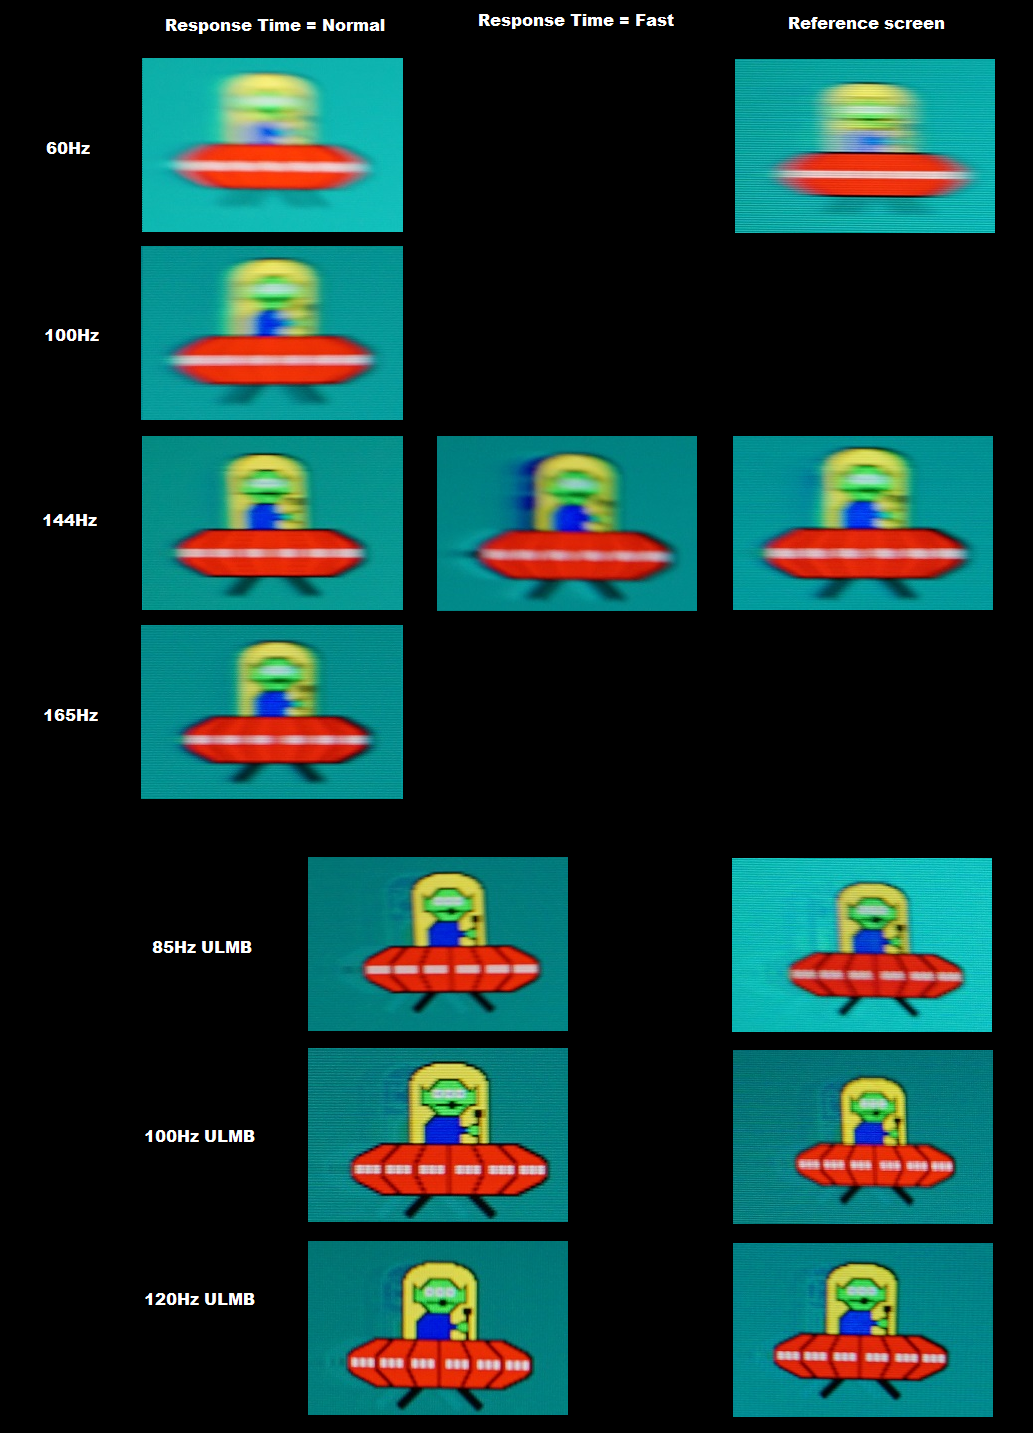
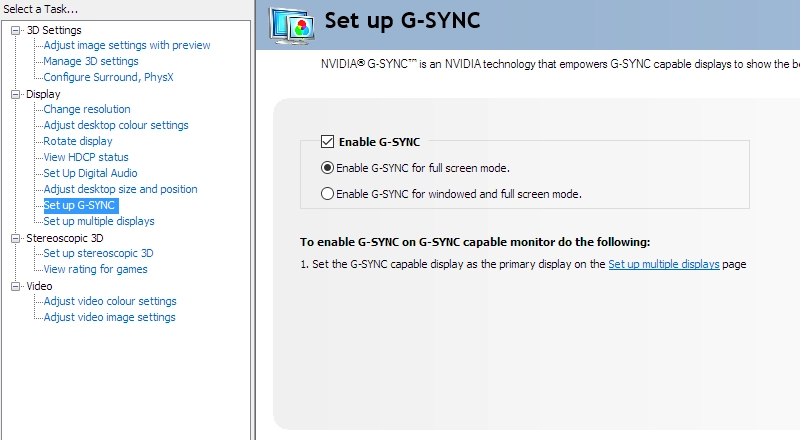
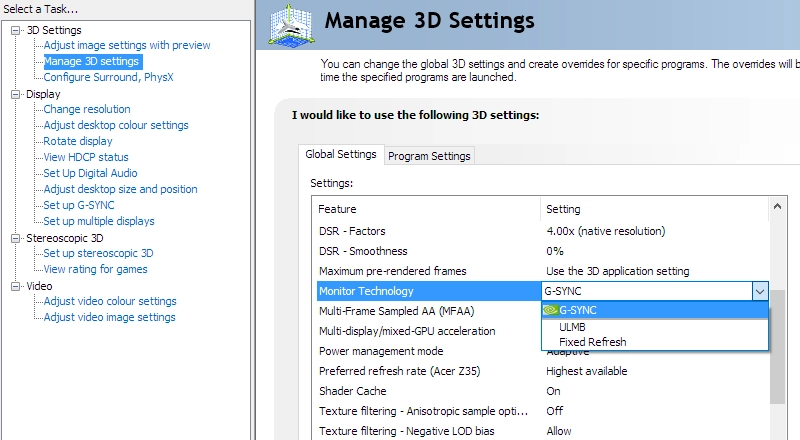
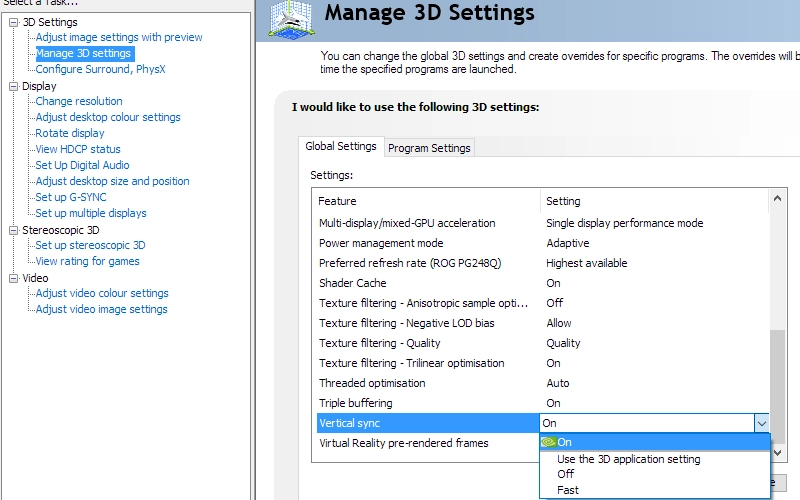
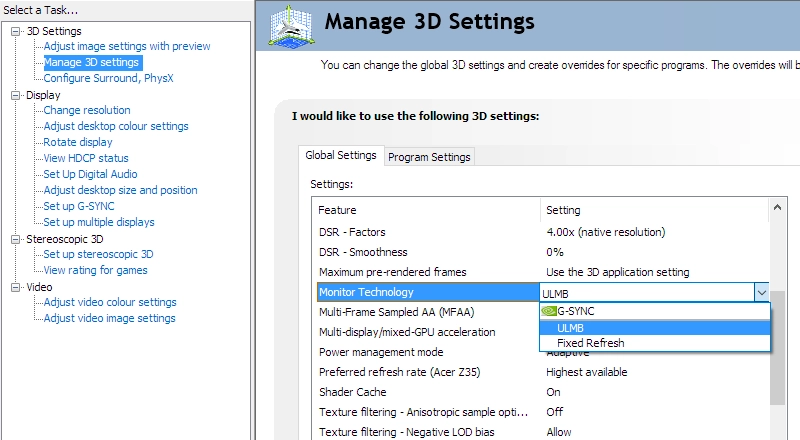
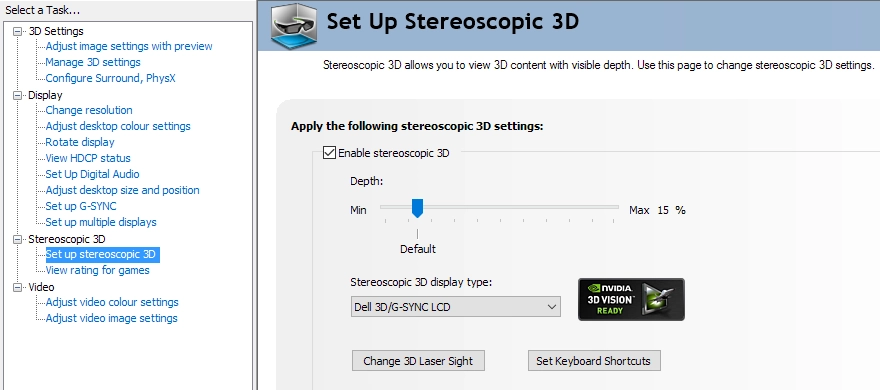
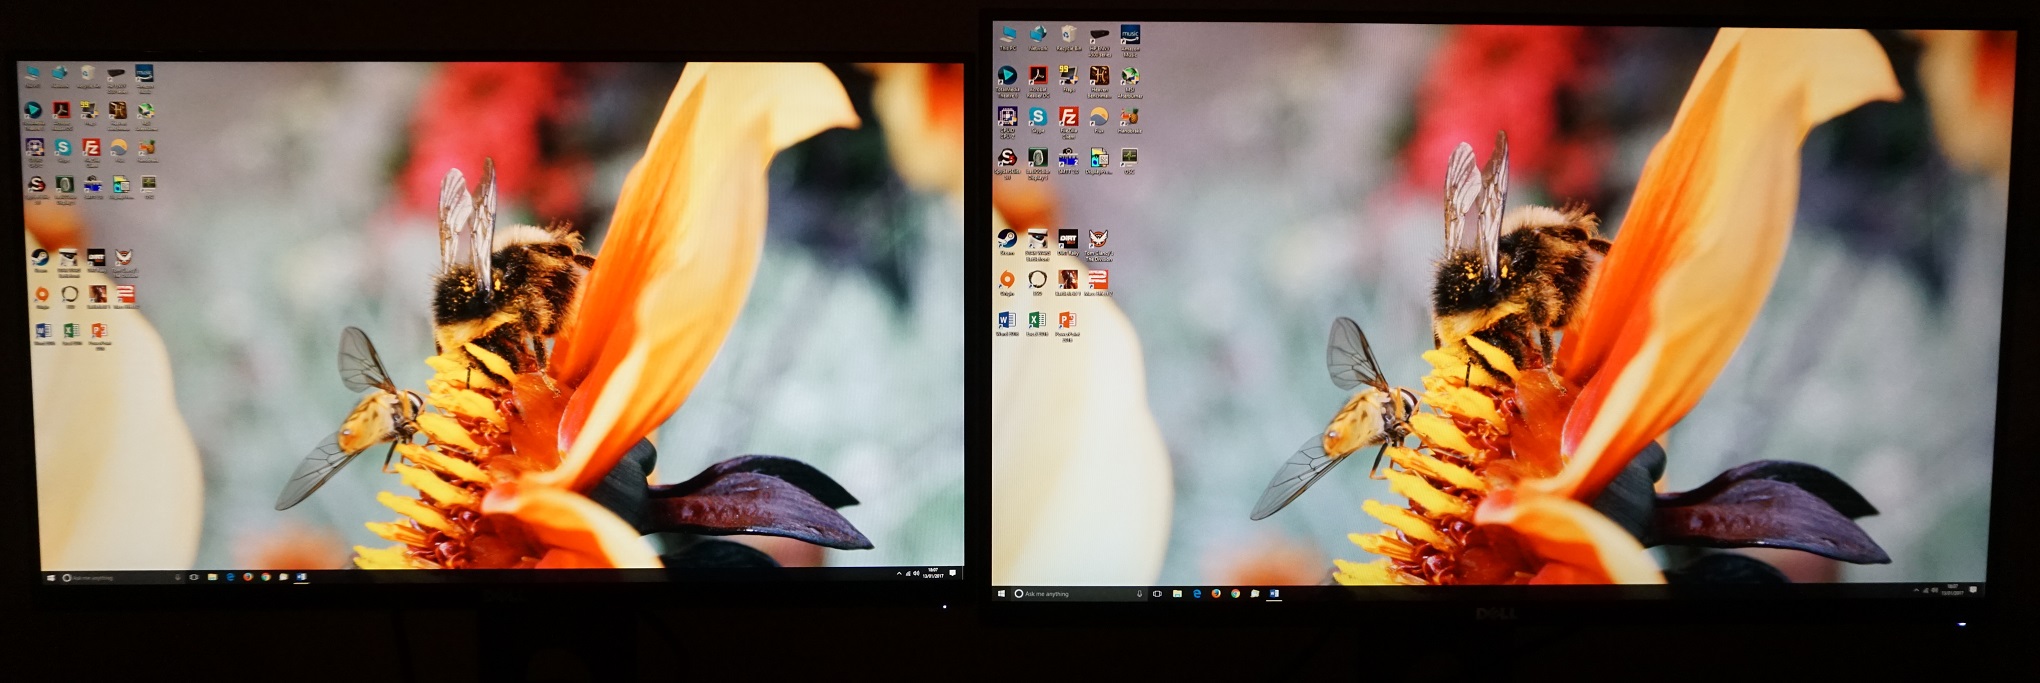
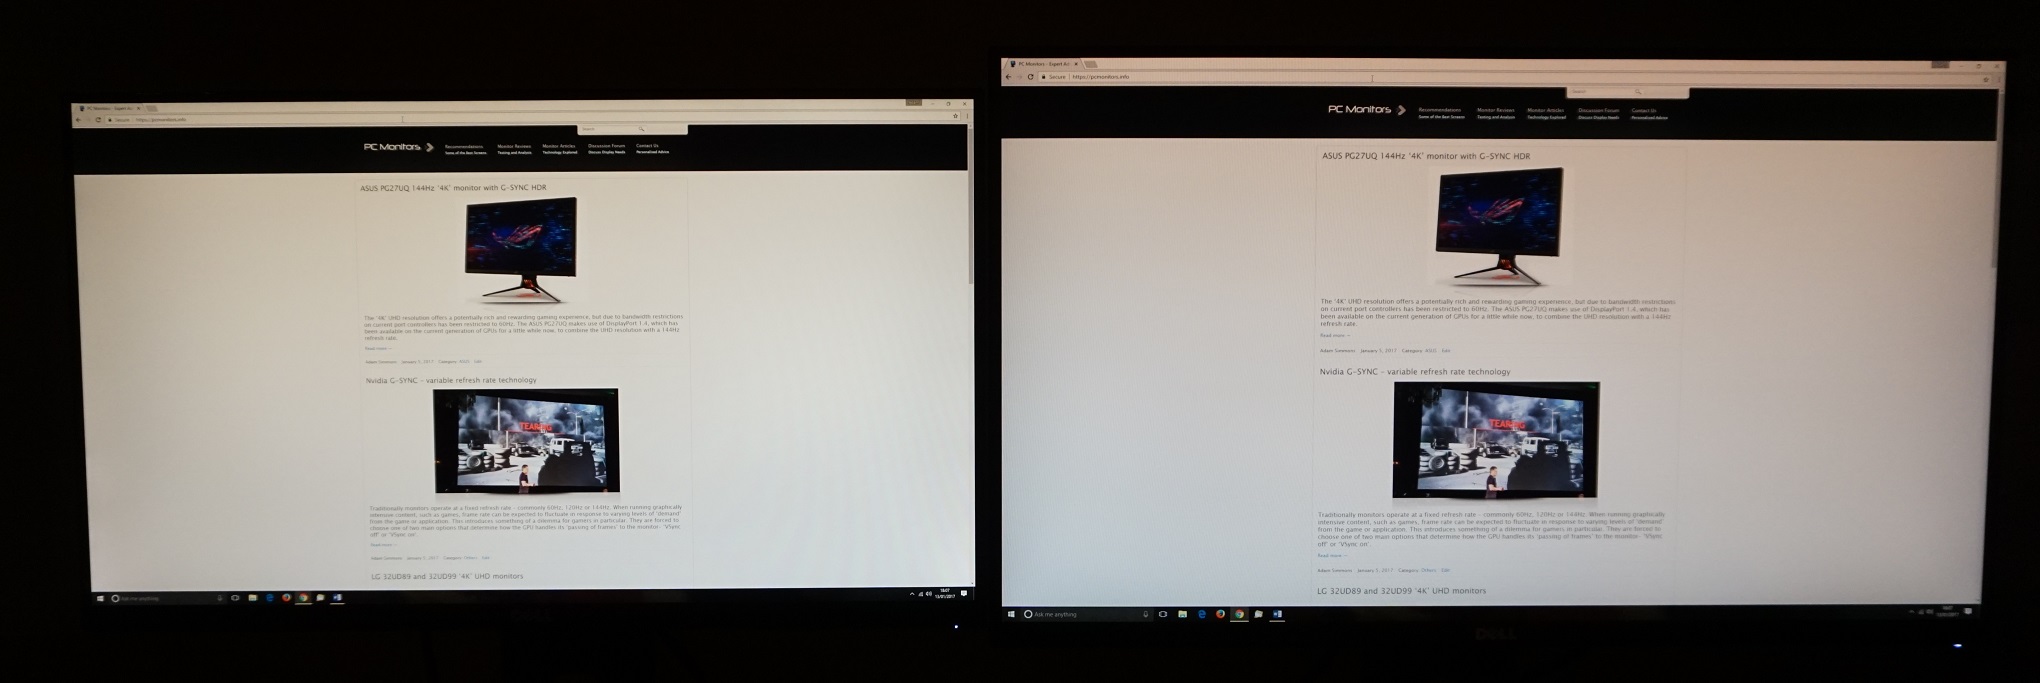
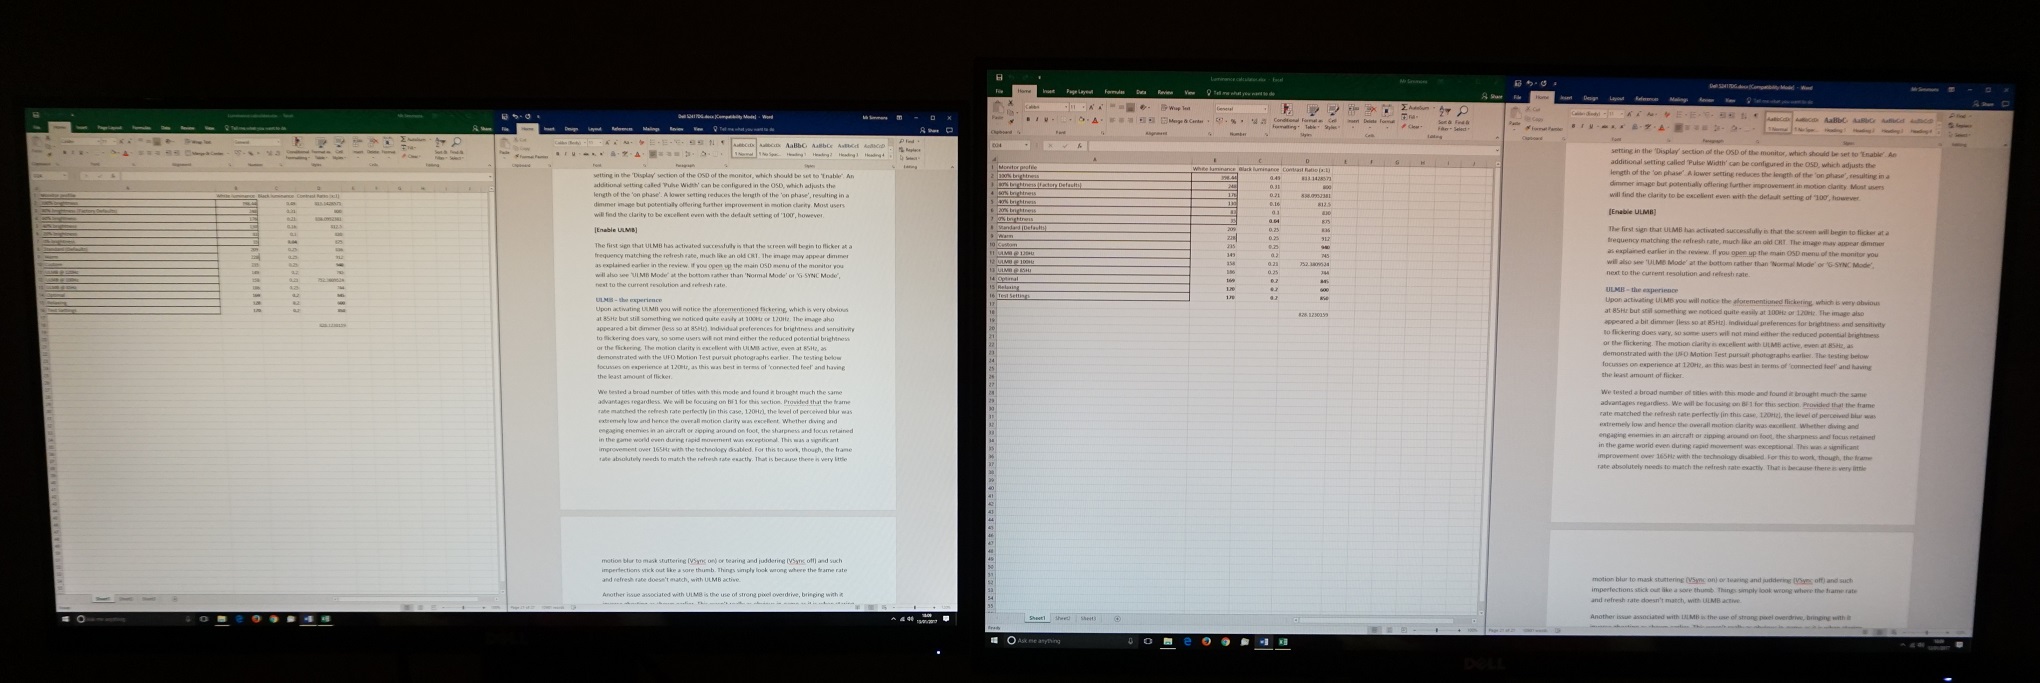
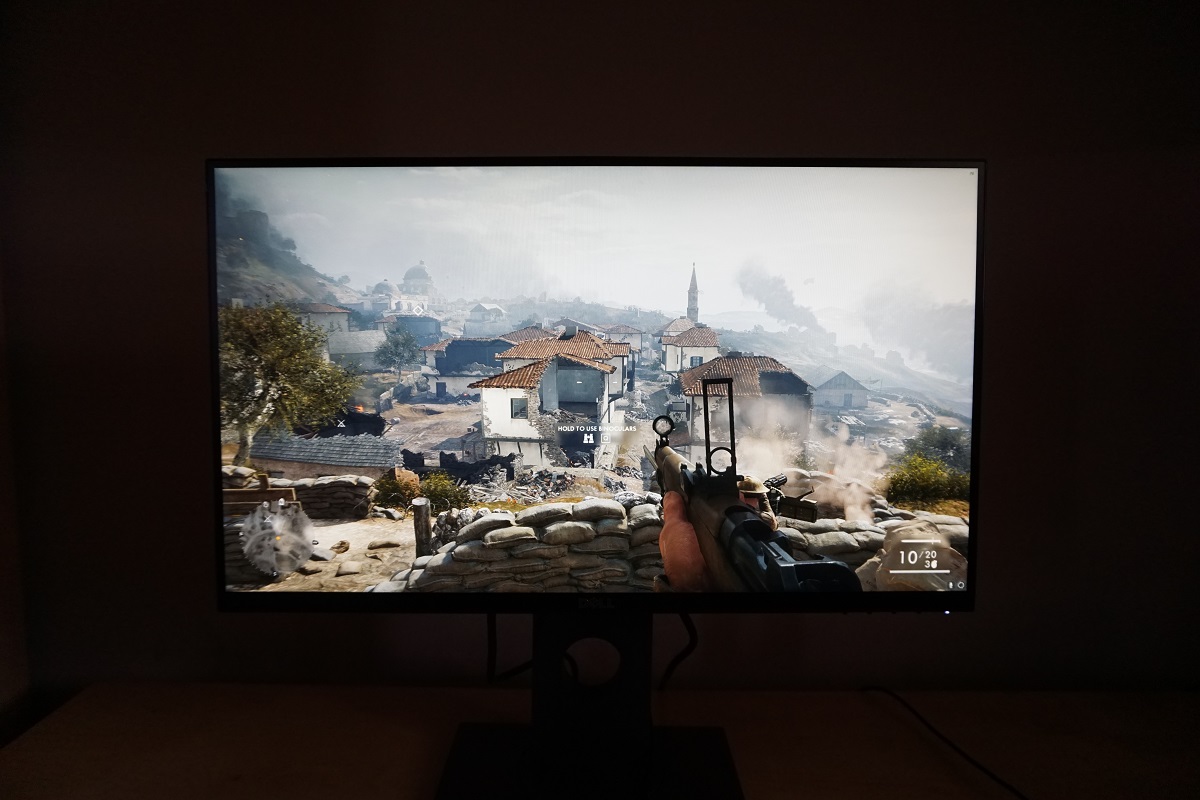
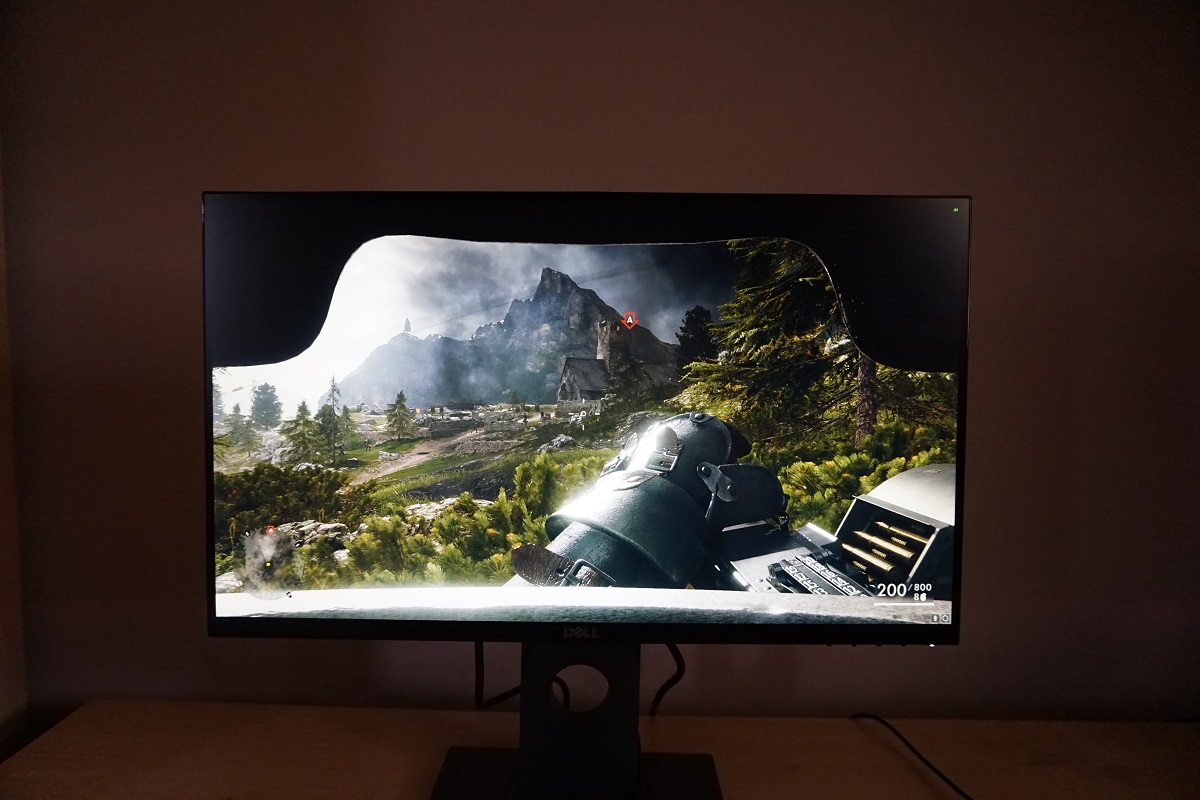
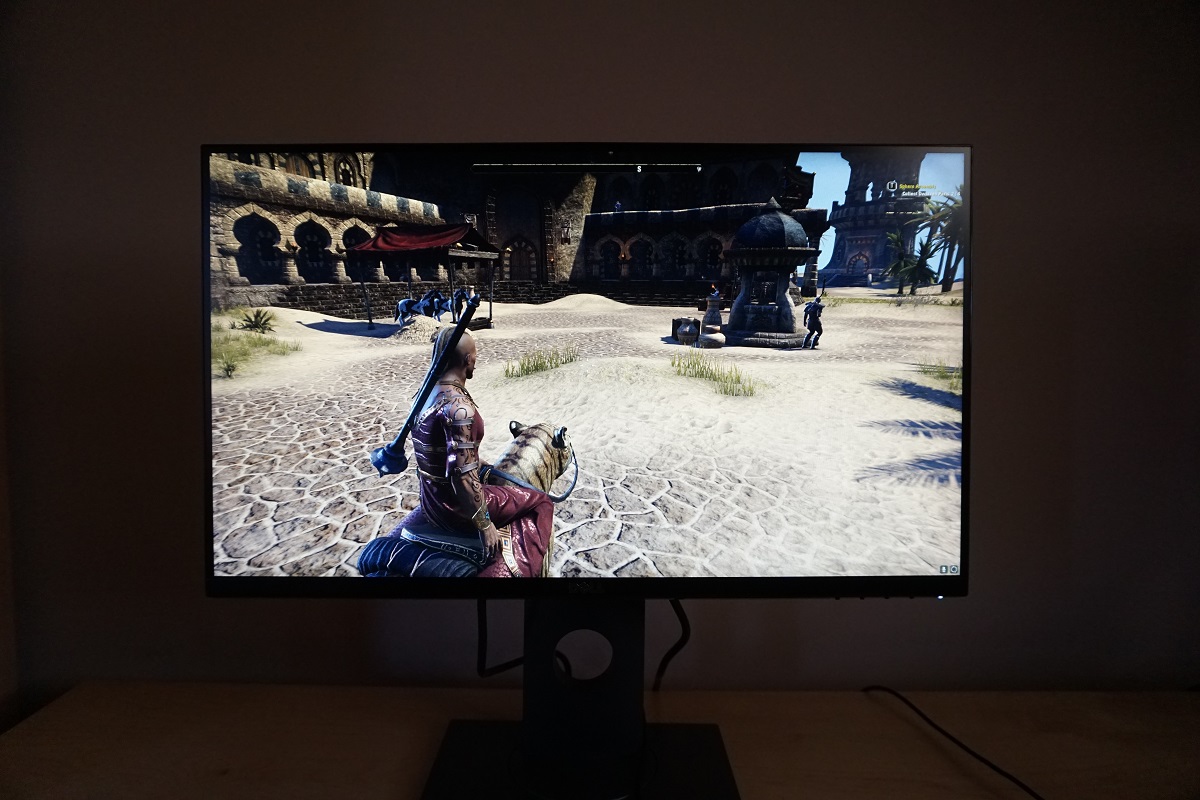
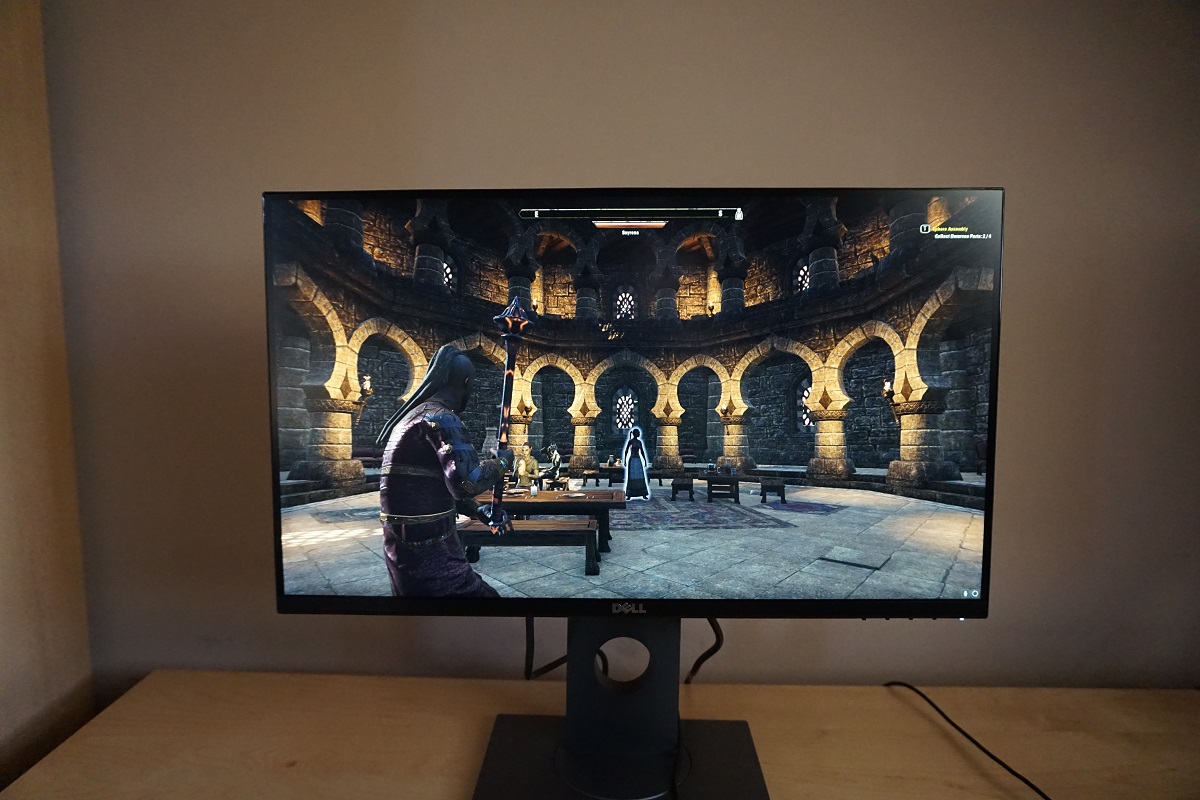
Whilst observing a black screen in a dark room we observed slight backlight bleed and a little bit of clouding, towards the bottom of the monitor. This is shown in the image below, taken with the monitor running our ‘Test Settings’. Note that individual units vary when it comes to backlight bleed. If you view the monitor ‘off-angle’, whilst observing dark content in a dimly lit environment, you can see a golden sheen in places. This could be dubbed ‘TN glow’ – it’s not anywhere near as intense as ‘IPS glow’ nor is it visible from a normal viewing position. It’s highlighted in a video on viewing angles deeper into the review. The luminance uniformity was good overall. The brightest point was recorded at ‘quadrant 6’ to the right of centre (163.7 cd/m²). The maximum deviation from this was recorded at ‘quadrant 7’, towards the bottom left of the screen (143.5 cd/m², which is only 14% dimmer). 12% and 11% deviations were recorded at ‘quadrant 9’ (bottom right) and ‘quadrant 8’ (bottom centre), respectively. Elsewhere measured luminance deviated just 1-6% from the central point, which is excellent. Note that luminance uniformity can vary between individual units and that you can expect some deviation beyond the measured points. Due to the viewing angle restrictions of the TN panel, you can also perceive changes that are not measured by a colorimeter. Below is a contour map which shows these deviations graphically, with lighter greys representing higher luminance and hence lower deviation from the brightest point than darker greys. The percentage deviation between each quadrant and the brightest quadrant is also provided. Due to the viewing angle limitations, we will not be providing analysis of colour temperature variation using the colorimeter. The perceived variations here due to these viewing-angle related shifts can largely counteract measured deviations, even when you’re simply observing different sections of the screen from a normal viewing angle. On Battlefield 1 (BF1) the contrast performance was reasonable overall. Dark areas, such as building interiors and shadowy exterior locations, had well-defined detail. There was some detail loss towards the very top of the screen, with some extra detail revealed centrally and to a greater extent lower down the screen. The extra detail towards the bottom of the screen was primarily due to the viewing angle weaknesses (perceived gamma shifts) mentioned earlier and associated with the TN panel. This variation comparing to the top to bottom of the screen was not as noticeable from a normal viewing position as on the larger S2716DG where the viewing angle difference is more significant comparing the top to bottom regions of the screen. There was no ‘IPS glow’ or anything like that to sap away detail towards the corners of the screen, either. Bright elements such as explosions and gunfire in contrasted well with darker surroundings, whilst brighter shades appeared fairly smooth (free from obvious graininess) due to the screen surface. Dirt Rally provided a similar contrast experience. This game has some particularly dark night environments and again illustrated the decent dark scene representation of the monitor overall. There was again some loss of detail further up the screen and extra unintended detail elsewhere. Particularly near the bottom. Bright elements such as car headlights contrasted nightly and didn’t appear overly grainy, as they would on some matte screen surfaces. This helped give them a purer look with superior ‘pop’ as well. There was no ‘IPS glow’ to impede detail levels near the bottom corners of the screen or elsewhere either, which was a nice bonus in dark scenes. We also assessed the Blu-ray of Star Wars: The Force Awakens. This film is a good test for contrast and benefits greatly from strong performance in this area, with many scenes involving bright objects or special effects lighting up very dark environments. The monitor put in a decent performance, obviously not capturing the contrast experience seen on models with much stronger contrast (decent VA LCDs, for example) but still representing things quite well. The overall level of detail in dark scenes was respectable and bright elements stood out very nicely, again appearing relatively smooth due to the screen surface. We used Lagom’s tests for contrast to more closely analyse specific strengths and weaknesses in contrast performance. The following observations were made. The colour gamut of the S2417DG (red triangle) is compared with the sRGB colour space (green triangle) using the Spyder5ELITE in the image below. The colour gamut is very similar to the 27” monitor, offering quite comprehensive sRGB coverage. There’s just a little bit of under-coverage in places and a bit of over-coverage, particularly in the green and red corners of this particular gamut representation. This gives the monitor a bit of extra vibrancy potential which suits its intended uses. On BF1 shades had a rich and natural look, with good variety. As explored earlier, some shades did lose saturation lower down the screen and gain slightly excessive depth further up the screen even if represented correctly centrally (from a normal viewing position). Forested areas, for example, have a broad range of green and brown shades in the game and these tend to appear more lush than intended near the top of the screen and more muted near the bottom. This means the distinction between closely matching shades isn’t there to the same degree as on panels with stronger viewing angle performance, particularly IPS-type panels. Having said that, the overall representation was good and certainly rich rather than ‘washed out’ overall. There were plenty of nice rich earth brown shades and lush green shades, giving the environments a believable look. There were some nice vivid oranges and reds displayed, making explosions and gunfire appear suitably lively as well. Overall the colour reproduction, although bound by the usual TN restrictions, provided a rich and engaging experience on this title. Dirt Rally showcased a good range of rich shades, with a good variety of racing environments to show these off. These environments appeared natural and largely as they should, although the aforementioned saturation shifts did still apply. There was a nice depth and richness to various green shades whilst more muted dusty khaki shades were also well represented. Some of the more vibrant and eye-catching colours in this title come from the car paintjobs. There was some rather striking neon greens, bright yellows and bright pinks showcased here. These again lost a bit of pizazz towards the bottom of the screen, where saturation was weaker, but never really went as far as looking ‘washed out’ even here. The intended look was captured on this title quite well, be in natural-looking racing environments or vibrant shades of paint designed to catch the eye. We also tested the Blu-ray of Futurama: Into the Wild Green Yonder, to assess colour reproduction. With its large areas of individual shade this is one of our favourite tests for colour reproduction – it is rather unforgiving. This title highlighted the TN-related colour consistency weaknesses. The skin tone of a given character, for example, appeared the same as another character should at certain points of the screen. This ‘shade-crossover’ applied more broadly and meant that subtle shade variety and identity was diminished. The overall grouping of shades was correct, though, in that vibrant neon colours lived up to their name, deep colours appeared deep and full overall and more muted shades appeared suitably pastel overall. Although we hate to generalise too much, we’d say that this title also looked more on the ‘vibrant’ than ‘washed out’ end of the spectrum – but in a good way, not an oversaturated way. Lagom’s viewing angle tests were used to more closely analyse the colour consistency and viewing angle limitations. The following observations were made from a normal viewing position, eyes around 70cm from the screen. As covered in the OSD video earlier, there is an ‘Overclock’ feature in the ‘Display’ section of the OSD. This overclocks the refresh rate of the panel, which is natively 144Hz, to 165Hz. You can alternatively select an overclocked refresh rate of 150Hz, 155Hz or 160Hz. Even at 165Hz we did not observe any issues on our unit with continuous running at this refresh rate, which is why we settled on this for most of our testing. Most users should find it works without issue on their system, but be aware that the DisplayPort cable you’re using could potentially cause issues – specifically a long or poor quality cable could cause signal dropouts. Although DP is a digital signal and there is no such thing as ‘revisions’ of a cable (DP 1.1, DP 1.2 etc.) it has proven itself to be a somewhat sensitive signal at elevated bandwidths (i.e. 2560 x 1440 @ 165Hz). We used both the DP cable included in the box and a ‘Cable Matters’ 6ft cable which we had to hand and had no issues with this feature with either cable. We used a small tool called SMTT 2.0 alongside a sensitive camera and a range of displays of known latency, to calculate the input lag of the S2417DG. Over 30 repeat readings were taken to help maximise accuracy. Using this method, we calculated 3.51ms (a little over half a frame at 165Hz) of input lag. This value reflects both the element of input lag you ‘see’ (pixel responsiveness) and that which you ‘feel’ (signal delay). It indicates a very low signal delay, which shouldn’t be bothersome even to sensitive users. We don’t have the means to accurately measure latency with G-SYNC doing its thing, but to us it felt very much light a low latency high refresh rate monitor should with this technology active. In this article we explore key factors which affect a monitor’s responsiveness. A concept called ‘perceived blur’ is introduced, which is contributed to not only by the pixel responsiveness of the monitor but also the movement of your eyes as you track motion on a screen. For modern monitors this second factor is actually the most significant. A special photography technique called ‘pursuit photography’ is also introduced, which uses a moving camera to capture the perceived blur on a monitor in a way that reflects both pixel responsiveness and eye (camera) movement. The images below are pursuit photographs taken using the UFO Motion Test for ghosting, with the middle row (medium cyan background) used. The test was run at its default speed of 960 pixels per second, which is a good practical speed for such photographs and highlights both elements of perceived blur nicely. The UFO moves across the screen from left to right at a frame rate matching the refresh rate of the monitor. The monitor was set to a range of refresh rates – 60Hz, 100Hz, 144Hz and 165Hz. It was also set to 85Hz, 100Hz and 120Hz with its ULMB feature active and the ‘Pulse Width’ set to its default value of ‘100’. The ‘Fast’ response time setting is only shown at 144Hz as the nature of the trailing (or more specifically, overshoot) is the same regardless of refresh rate. The final column shows a ‘Reference Screen’ running at 60Hz and 144Hz plus all of the refresh rates tested with ULMB. This reference screen is a Dell S2716DG set to its optimal ‘Normal’ response time setting (where applicable), which provides a useful comparison as a highly responsive 144Hz monitor that this model will naturally be compared with. Note that any interlacing in these photographs is moiré from the camera and not observed on the monitor itself. At 60Hz the UFO appears noticeably blurry, with a lack of fine detail. This is caused almost entirely by eye movement – there is very little trailing or overshoot (inverse ghosting) visible behind the UFO. It is largely comparable to the 60Hz reference (S2716DG) with a slightly ‘cleaner’ performance if anything due to a lack of dark trailing (overshoot) behind it. This is faint on the reference display, which is good, but absent on the S2417DG, which is better. At 100Hz the UFO becomes more sharply focused, indicating a significant decrease in perceived blur due to eye movement. There is no obvious trailing behind the object, either – just a very faint whiff of overshoot. At 144Hz the object becomes even more sharply focused, with some of the diner detail such as the segments of the UFO becoming more distinctive. There is a little bit of overshoot, but this is very faint – more so compared to the reference shot. This contrasts with the obvious inky trail of inverse ghosting (strong overshoot) behind the object using the ‘Fast’ setting. At 165Hz the fine details become even more distinctive and the object a little more sharply focused again. This signifies another improvement in perceived blur – and there is no obvious trailing or overshoot to speak of, either. With ULMB active you can see that the UFO is significantly sharper with the segments of the UFO body and the Alien’s face appearing more distinctive. The level of detail improves further at 100Hz and again at 120Hz – note the clarity of the white dots on the UFO body at 120Hz in particular. The perceived blur due to eye movement is extremely low, which accounts for the clarity of the object itself. ULMB does call for a strong overdrive impulse to be used, though, to prevent frame overlap. You can see the effect of that in the form of inverse ghosting behind the object. This is not as strong as using the ‘Fast’ response time setting with ULMB disabled – note again that the ‘Response Time’ setting can’t be adjusted with ULMB active. Performance here is extremely similar to the reference S2716DG, which is perhaps unsurprising given the overall similarities between the displays. Note that these images do not show the flickering which can be observed with ULMB active – this is mentioned earlier in the review and will be touched upon in the dedicated ULMB section as well. It is quite clear from this analysis and indeed analysing the monitor more broadly that the ‘Normal’ setting is optimal. Even at 165Hz, the monitor is able to provide a very ‘clean’ performance that is finely optimised – free from obvious trailing or overshoot. This will become even clearer during the subjective analysis that follows. That is an improvement over the 27” model, which had some more noticeable overshoot in places. It was not particularly obnoxious in our view, as we noted in the review, but the performance here is superior in that respect. Another advantage of the 23.8” model is that we did not observe interlace pattern artifacts (some people may call these ‘inversion artifacts’) either during motion or when observing static content. Where the frame rate kept pace with the 165Hz refresh rate (i.e. 165Hz) on BF1, the overall fluidity was excellent. The ‘connected feel’ as you interact with the game world was excellent, far superior to even the lowest latency 60Hz displays. The fact that the monitor was outputting 2.75 times as much visual information every second not only improved the ‘connected feeling’, but also greatly reduced perceived blur. This was obvious whether moving the mouse around and changing the character’s viewpoint, sprinting about or moving in a vehicle as the game world appeared more sharply focused. It was easier to track and engage ‘the bad guys’ as a result and for those sensitive to motion blur the experience was altogether less dizzying. With 165Hz/165fps, there was a slight advantage over even highly responsive 144Hz models (running at 144fps) such as the Dell S2716DG. This was true both in terms of the connected feel and level of perceived blur. The difference was only slight and much more subtle than moving from 60Hz up to 100Hz or from 100Hz up to 144Hz. And indeed sensitivity to this varies, so not everybody will appreciate this quite as much as others anyway. One thing we feel may be more broadly appreciated is the complete lack of obvious overshoot, even during the transitions that troubled this model’s 27” counterpart. There was nothing more than the faintest hint during a small number of transitions, nothing eye-catching at all. Despite this, there was no noticeable conventional trailing either. We also enjoyed the high frame rate 165Hz experience on Dirt Rally. It was easier to admire the scenery whilst tearing through it in a fast car with the reduced level of perceived blur afforded by the 165Hz refresh rate. This was again a subtle difference coming from 144Hz, but more appreciable compared to LCDs with lower refresh rates. We also felt very much ‘at one’ with our car due to the superior ‘connected feel’; nice though this was, it would be more of an advantage to users who are actually experienced and competent in racing games. And probably more noticeable if a steering wheel were used rather than a keyboard as well. There was again no obvious overshoot and no noticeable trailing from slower than optimal pixel response times. Clearly an excellent balance had been struck with the grey to grey acceleration on this monitor, even at 165Hz. To wrap up, we tested out Blu-ray movie titles. There were no weaknesses caused by less than optimal or stronger than optimal pixel overdrive; no trailing or overshoot was evident from the monitor. There was plenty of perceived blur and an overall visual fluidity that was severely impacted by the 24fps or so at which the titles run, however. There was a slight advantage to running the monitor at a multiple of this 24fps, such as 120Hz or 144Hz rather than 165Hz (or 60Hz) for movie watching. This reduces juddering due to the fact the frame rate fits neatly into the refresh rate. The monitor also offers a 24Hz option for purists out there, and this seemed to work as intended without frame skipping or other issues. G-SYNC is a variable refresh rate technology, available when compatible Nvidia GPUs are connected to compatible monitors such as this one. In our article on the technology, we explore the mechanisms of this and look at the benefits it brings to the user. We don’t intend to repeat this but will just reiterate the basic concept. ‘G-SYNC’ monitors have a proprietary chip inside the monitor that replaces the traditional scaler and some of the assistive electronics of the monitor. The monitor and GPU are able to communicate with each other in a way that allows the monitor to dynamically adjust its refresh rate according to the frame rate of the content. This synchronisation eliminates the tearing and juddering (VSync off) or stuttering (VSync on) that occurs where refresh rate and frame rate are misaligned. In addition to this, latency is reduced compared to VSync on (although we don’t have to means to accurately measure this, as mentioned earlier). The S2417DG supports Nvidia G-SYNC via DP 1.2a (the DisplayPort input of the monitor) when used alongside a compatible GPU with a variable refresh rate range of 30 – 165Hz. This automatically activated for us when the monitor was first connected, and this is usual behaviour. If G-SYNC is active you will see ‘G-SYNC Mode’ listed at the bottom of the OSD, next to the current resolution and refresh rate. To ensure things are set up correctly do the following. Open Nvidia Control Panel and navigate to ‘Display – Set Up G-SYNC’. Ensure that the checkbox for ‘Enable G-SYNC’ is checked and then select your preferred operating mode. As shown in the image below, the technology will work both in ‘Full Screen’ and ‘Window’ modes, depending on the selected option. If there doesn’t seem to be a G-SYNC section in your Nvidia Control Panel, try unplugging the monitor and plugging it into a different DP output on the GPU. Or failing that, reinstall the GPU driver. The next step after enabling the technology is to navigate to ‘Manage 3D settings’, where you will see two settings of interest. The first of these is ‘Monitor Technology’, which should be set to ‘G-SYNC’ as shown below. The second setting of interest is VSync. This can be set to; ‘On’, ‘Use the 3D application setting’, ‘Off’ or ‘Fast’ (GPU dependent). If ‘On’ is selected, VSync activates once the frame rate reaches the frame rate ceiling of the monitor (i.e. up to 165Hz / 165fps). If ‘Off’ is selected, the frame rate will go as high as the system can manage – the frame rate may rise above 165fps and tearing and juddering may be visible. Nvidia initially advised that users select a definite VSync setting in the driver and disable any in-game implementation, in case that implementation interfered with the smooth running of G-SYNC. In our experience, it doesn’t make any difference whether it is enforced via the driver or the game. The ‘Fast’ setting is available on certain newer GPUs, including the GTX 1070 used in our test system. This enables ‘Fast Sync’ which comes into play where the frame rate exceeds the G-SYNC ceiling (up to 165Hz / 165fps). G-SYNC operates as usual below this whilst a special version of VSync called ‘Fast Sync’ comes into play above this. ‘Fast Sync’ is specifically designed at very high frame rates, ones that comfortably exceed the refresh rate ceiling of the monitor by quite some margin. The technique is supposed to combine the minimal latency of ‘VSync off’ without the level of tearing associated with that option. This is a GPU feature rather than a monitor feature, so isn’t something we’ll be exploring in depth. We’d advise referring to this section of a video by Tom Petersen if you’re interested in the technology and how it works alongside G-SYNC. Regardless of which VSync setting you select, the refresh rate of the monitor behaves in exactly the same way where the frame rate dips below the floor of operation (lowest refresh rate / frame rate supported which is 30Hz / 30fps). The monitor will stick to multiples of the frame rate with its refresh rate, essentially eliminating stuttering and tearing from situations where the frame rate and refresh rate are not perfectly matched or in neat multiples. If the game dropped to 26fps, for example, the monitor would run at 46Hz rather than simply staying at 30Hz or switching to a static 165Hz. Whilst this is effective in combating stuttering and tearing, low frame rates are still low frame rates regardless of G-SYNC and the experience is far from fluid. Also note that stuttering issues related that have nothing to do with the refresh rate and frame rate mismatch (latency, low RAM etc.) will not be rectified either. We tested G-SYNC on a range of titles including Tom Clancy’s The Division, Star Wars Battlefront and Dirt Rally. The technology worked flawlessly on titles we tested and did exactly what it set out to do. Instead of repeating observations over a range of titles, which would be similar, we will be focusing on Battlefield 1 (BF1). This offers a suitable range of graphics options to allow G-SYNC to be tested over its full range of frame rates and refresh rates. Using settings we are happy to use there was a fair bit of fluctuation in frame rate, but it generally kept to triple digits (between 100fps and 165fps). Without G-SYNC active and a static 165Hz refresh rate used, these fluctuations and departures from the refresh rate would cause obvious (to us) tearing and juddering with VSync off and obvious (to us) stuttering with VSync on. With G-SYNC active these interruptions were not present and the overall experience was significantly smoother and more enjoyable. There was still benefit where the framerate was at the upper end of the range, though, as this decreased perceived blur by a fair bit. It also improved the ‘connected feel’ and as far as framerate goes it was still a case of ‘the higher the better’ in that respect, regardless of G-SYNC. If we increased the eye candy by enabling the ‘Ultra’ preset, the frame rate dropped to around 80fps, with fluctuations typically between around 60 – 100fps. Without G-SYNC this again caused tearing and juddering (VSync off) or stuttering (VSync on), both of which were somewhat more noticeable at these reduced frame rates and something we found quite jarring. The perceived blur and connected feel was again impacted by these reduced frame rates in a negative way, but playability was certainly improved compared to with G-SYNC disabled. By increasing ‘Resolution Scale’ beyond 100% the demand on the GPU was increased significantly and unsurprisingly framerate took a hit. As framerate fell away the ‘connected feel’ became more of a ‘disconnected feel’ and perceived blur increased to new levels, but the lack of stuttering and tearing was maintained regardless. This was even the case below the 30fps minimum that G-SYNC could handle by direct refresh rate matching (30Hz), with the monitor keeping tearing and stuttering in check by settings its refresh rate to multiples of the frame rate. We certainly felt that G-SYNC was beneficial to the gaming experience. Low frame rates were low frame rates regardless and we preferred the frame rate to be as high as possible, but the slight mismatches that were pretty much inevitable on titles like BF1 were far more palatable with G-SYNC. It’s worth remembering that individual sensitivity to tearing and stuttering varies. Whilst some users are quite sensitive to it and therefore find it noticeable and bothersome, others don’t really mind it so much. In our experience most users do find a degree of benefit from G-SYNC, sometimes a significant one, and find it difficult to go back to gaming on monitors without such a variable refresh rate technology. ULMB (Ultra Low Motion Blur) is another proprietary Nvidia technology which can be enabled instead of G-SYNC on compatible models. This is a strobe backlight technology specifically designed to reduce motion blur using the mechanism described here. Essentially the backlight rapidly pulses on (‘on phase’) and off’ (‘on phase’), with the ‘on’ phases being much briefer than the ‘off’ phases. This strobing behaviour greatly reduces the amount of time that your eyes spend tracking motion on the screen. As it is eye movement that is the most significant contributor to perceived blur on a modern monitor, the perceived blur is greatly reduced. ULMB requires a compatible Nvidia GPU and we would again like to stress that this option can’t be activated at the same time as G-SYNC. ULMB can be enabled by first setting the monitor to 85Hz, 100Hz or 120Hz via Windows or the Nvidia Control Panel. The next step is to navigate to ‘Manage 3D settings’ in the Nvidia Control Panel and select ‘ULMB’ for ‘Monitor Technology’ as below. There is also a ‘ULMB’ setting in the ‘Display’ section of the OSD of the monitor, which should be set to ‘Enable’. An additional setting called ‘Pulse Width’ can be configured in the OSD, which adjusts the length of the ‘on phase’. A lower setting reduces the length of the ‘on phase’, resulting in a dimmer image but potentially offering further improvement in motion clarity. Most users will find the clarity to be excellent even with the default setting of ‘100’, however. The first sign that ULMB has activated successfully is that the screen will begin to flicker at a frequency matching the refresh rate, much like an old CRT. The image may appear dimmer as explained earlier in the review. If you open up the main OSD menu of the monitor you will also see ‘ULMB Mode’ at the bottom rather than ‘Normal Mode’ or ‘G-SYNC Mode’, next to the current resolution and refresh rate. Upon activating ULMB you will notice the aforementioned flickering, which is very obvious at 85Hz but still something we noticed quite easily at 100Hz or 120Hz. The image also appeared a bit dimmer (less so at 85Hz). Individual preferences for brightness and sensitivity to flickering does vary, so some users will not mind either the reduced potential brightness or the flickering. The motion clarity is excellent with ULMB active, even at 85Hz, as demonstrated with the UFO Motion Test pursuit photographs earlier. The testing below focuses on experience at 120Hz, as this was best in terms of ‘connected feel’ and having the least amount of flicker. We tested a broad number of titles with this mode and found it brought much the same advantages regardless. We will be focusing on BF1 for this section. Provided that the frame rate matched the refresh rate perfectly (in this case, 120Hz), the level of perceived blur was extremely low and hence the overall motion clarity was excellent. Whether diving and engaging enemies in an aircraft or zipping around on foot, the sharpness and focus retained in the game world even during rapid movement was exceptional. This was a significant improvement over 165Hz with the technology disabled. For this to work, though, the frame rate absolutely needs to match the refresh rate exactly. That is because there is very little motion blur to mask stuttering (VSync on) or tearing and juddering (VSync off) and such imperfections stick out like a sore thumb. Things simply look wrong where the frame rate and refresh rate doesn’t match, with ULMB active. Another issue associated with ULMB is the use of strong pixel overdrive, bringing with it inverse ghosting as shown earlier. This wasn’t really as obvious in-game as it is when staring at static photographs specifically highlighting it, though. It generally appears as a faint partially transparent or slightly shadowy trail behind some objects. Because the backlight is strobing, it appears quite distinct from the object – like a faint repetition of the object rather than a smooth trail behind it. All monitors using ULMB have this to either a similar or more extreme degree and we don’t feel it really detracts from the overall benefits of the technology. For most users, though, we feel G-SYNC will be preferred – note again that you can’t use both technologies at the same time. The flexibility it provides with frame rate, level of 165Hz ‘connected feel’ (which is better than the 120Hz maximum of ULMB) and lack of flicker will see a mass appeal that ULMB doesn’t. But it’s definitely a useful tool for some users, particularly those who are used to gaming on CRTs or play titles where consistently high frame rates and extreme paces of action are the norm. This monitor supports Nvidia 3D Vision (1 and 2). An emitter is not integrated into the monitor, but the technology will work provided you have the full kit (emitter + glasses). You can set this up once the emitter is plugged in by opening Nvidia Control Panel and navigating to ‘Stereoscopic 3D – Set up stereoscopic 3D’. You then select the ‘Enable stereoscopic 3D’ checkbox and run through the setup procedure. The image below shows this section of the Nvidia Control Panel. As we do not have an Nvidia 3D Vision set, we were unable to test this feature. We would recommend that users read the relevant section of ASUS PG278Q review, as the experience should be similar in many respects. It will at least give some indication of what to expect from the experience. We have already shared some reasonably detailed thoughts on what sort of experience you can expect when running the WQHD resolution on a 23.8” screen and how this compares to a 27” WQHD screen and ~24” Full HD screen. Please refer to the ‘2560 x 1440 (WQHD) experience on a 23.8” screen’ section of the Dell P2416D review, which is located just before the ‘Interpolation and upscaling’ section as it is here. We will not be repeating too much of what has already been said, but will simply reiterate a few points and show the screen in action. We will also be focusing on a comparison with a 27″ WQHD screen rather than a ~24″ Full HD screen for the photographs. The pixel density of a 23.8” screen like the Dell S2417DG with 2560 x 1440 (WQHD) resolution is 123.41 PPI (Pixels Per Inch). This is 13.4% higher than the 108.79 PPI of a 27” WQHD screen such as the Dell S2716DG. Text and UI elements therefore appear somewhat smaller, although not drastically so, on the 23.8” vs. 27” WQHD screen. The images below show the desktop, a website and some Microsoft Office applications running side by side on both Dell models. The S24 is on the left and S27 is on the right. We could very comfortably use either monitor without using any scaling, but that will depend on preferences and eyesight as well as preferred viewing distance. The 13.4% higher pixel density also provided a bit of a boost in terms of the apparent clarity and detail when gaming. This was a reasonably subtle difference and not as noticeable as when comparing either model to a 32” or smaller ‘4K’ UHD model where the pixel density is >137.68 PPI. We would again recommend referring to the relevant section of our P2416D review for further thoughts on this comparison. We will now leave you with some images of the monitor in action whilst playing some games. These images are purely for illustrative purposes as they do not accurately convey how the monitor is to use or see in person. As is usual with G-SYNC monitors, the G-SYNC module replaces the usual DisplayPort scaler. This means that if you have the monitor connected to a system via DisplayPort, any scaling is handled by the GPU rather than the monitor. Non-native resolutions such as 1920 x 1080 (Full HD) appear significantly softer than when they are run natively on a ~24” Full HD monitor. Alternatively, if ‘No Scaling’ (or the equivalent) is selected in the graphics driver then only 1920 x 1080 pixels are illuminated. You get ~17.5” diagonal for the image itself and a large black border surrounding it. The monitor does have a scaler that can be used when it is connected to a system (be it a PC, games console or something else) via HDMI. This does a better job than GPU scaling, so to make sure it is being used navigate to ‘Display – Adjust desktop size and position’. Ensure that ‘No Scaling’ is selected and ‘Perform scaling on:’ is set to ‘Display’ as shown below. If you are a renegade and are using an AMD GPU or games console with the monitor, scaling will automatically be handled by the monitor via HDMI, when gaming. The interpolation process used by the monitor does provide an image that is somewhat softer than a ~24” monitor running the resolution natively, but it is significantly better than GPU scaling in this respect. If you run at 1920 x 1080, for example, objects in the distance and textures in general have a bit of a softer look than intended. But it doesn’t look like the game environment is being viewed through a soft-focus lens. There is a certain ‘HD quality’ to the image. If you need to use 1920 x 1080 or other non-native resolutions on the monitor, it’s fine to do so as a secondary use. The video below summarises some of the key points raised in this written review and shows the monitor in action. The video review is designed to complement the written piece and is not nearly as comprehensive. We quite broadly praise the Dell S2716DG for its gaming performance, so it was interesting to see how its smaller brother performed in this role. The 23.8 screen, packed with just as many pixels as the larger model (2560 x 1440), had a slight edge in pixel density. Text and UI elements were slightly smaller on the desktop, but still perfectly readable in our view, whilst games benefited from a small edge in clarity and apparent detail. This was a fairly subtle difference, certainly when compared to UHD models of similar size or larger (up to 32” or so). The features and aesthetics remained much the same as the larger model, with an even smaller stand footprint. Not that the S2716DG was problematic in that respect, of course. The ergonomic flexibility was maintained and so was the range of ports. Out of the box the image quality was somewhat better than the 27” model in as much as the gamma tracked closer to the desirable ‘2.2’ curve. It wasn’t perfect and benefited from a bit of ‘neatening up’ with an ICC profile, but the overall image was still quite rich and varied regardless. With the monitor set up to our liking, as per our ‘Test Settings’, the image was remarkably similar to the 27” model. Things appeared far closer to ‘rich’ than ‘washed out’ on the whole, although the usual TN caveats related to viewing angle and perceived saturation changes comparing lower down to further up the screen still applied. The screen surface was similar to new revisions, with a light and smooth finish that kept the image free from obtrusive graininess. This was in stark contrast to earlier revisions of the 27” model which featured a noticeably grainier ‘medium’ matte anti-glare surface. Speaking of contrast, this was decent but by no means amazing on the S2417DG. Following setup as per our ‘Test Settings’, static contrast sat at around 850:1 – a little weaker than the ~1000:1 of the 27” model but no obvious perceivable differences in that respect. There was no ‘IPS glow’ or anything of that nature, so good detail levels were maintained peripherally. There was some loss of detail towards the top of the screen due to the perceived gamma changes associated with TN viewing angle restrictions. There was also some extra extra unintended detail revealed centrally and moreover lower down the screen. The shifts comparing top to bottom were a bit more subtle than on the larger S2716DG. Responsiveness was very impressive, with no obvious weaknesses in pixel responsiveness even up to the maximum 165Hz supported by the monitor and very low input lag. The slightly higher refresh rate (165Hz vs. 144Hz) also gave just a slight edge in ‘connected feel’ and slightly lower perceived blur, but this was hardly a difference to write home about. What we did find more noticeable, though, was the complete lack of obvious overshoot on the S2417DG. The 27” model certainly had nippy pixel responses, but there was also some fairly obvious overshoot in places. This model maintained the nippy pixel responses with only a trace of overshoot here and there – nothing at all bothersome or that most users could even detect. The Nvidia-specific features such as G-SYNC and ULMB worked exactly as intended as well, busting tearing/stuttering and reducing perceived blur, respectively. Overall this monitor delivers much of what its larger brother does, in a smaller and lower-priced package. Overall image quality is decent, certainly following calibration, whilst responsiveness is exceptional. The improvements to the pixel overdrive tuning (i.e. lower overshoot) will be very much welcomed by some users, whilst the 165Hz capability provides a nice little bonus that some will admire. As far as gaming monitors go, you could do far worse than this one. The bottom line; a no-nonsense gaming monitor that combines exceptional responsiveness with a good feature-set, sensible design and attractive price.
The Spyder5ELITE was also used to assess the uniformity of lighter colours, represented by 9 equidistant quadrants running from the top left to bottom right of the screen. The following table shows the luminance recorded in each quadrant as well as the percentage deviation between each quadrant and the brightest point recorded.
Luminance uniformity table
Luminance uniformity map
Contrast in games and movies
Lagom contrast tests
Colour reproduction
Colour gamut
Colour gamut test settings
Colour in games and movies
Viewing angles
The video below shows this test from a variety of viewing angles, alongside a mixed and dark desktop background from various angles. Note how readily the Lagom stripe colours on the text shift and that there is even some ‘colour inversion’ beyond a certain point vertically for the desktop background. Again this is typical for a TN model and not a specific weakness of this monitor only.
Responsiveness
A note on overclocking
Input lag
Perceived blur (pursuit photography)
Responsiveness in games and movies
G-SYNC – the technology and activating it
Enable G-SYNC
Set Monitor Technology to G-SYNC
Set VSync according to preferences
G-SYNC – the experience
ULMB – the technology and activating it
Set Monitor Technology to ULMB
ULMB – the experience
3D Vision 2
Activate 3D Vision
The 2560 x 1440 (WQHD) experience on a 23.8” screen
Interpolation and upscaling

Video review
Conclusion
Positives Negatives Image appears quite rich and varied straight from the box, without the sort of obvious washed out look that many ‘gaming monitors’ are cursed by
Slight gamma weakness leading to some shades appearing a bit lighter than they should, requiring intervention of an ICC profile to correct properly. Perceived gamma and saturation affected by TN viewing angle restrictions
Decent static contrast without ‘IPS glow’ impeding the performance and a fairly smooth appearance to the image thanks to the light matte anti-glare screen surface
Static contrast a bit weaker than some models, even with the same panel type. The TN-related gamma inconsistencies affect detail levels in dark environments, with extra detail revealed centrally and further down the screen. Whereas near the top where some detail is lost due to much higher perceived gamma Very nicely tuned pixel responsiveness, very little input lag, no ‘interlace pattern artifacts’ and the ability to run at up to 165Hz. The Nvidia trio of G-SYNC, ULMB and 3D Vision is also welcome Slight traces of overshoot here and there, but very faint and unobtrusive. Overshoot more noticeable with ULMB active, but that’s always the case and often it’s worse than this
A smart design with minimal stand footprint, good ergonomic flexibility and some useful ports. HDMI provides the ability to connect games consoles and suchlike, whils the decent interpolation performance helps output 1920 x 1080 without the level of softness associated with some higher resolution displays
The OSD is somewhat cut-down compared to some models, including those from Dell. No ‘Low Blue Light’ setting or gamma settings to be found
As an Amazon Associate I earn from qualifying purchases made using the below link. Where possible, you’ll be redirected to your nearest store. Further information on supporting our work.
