Author: Adam Simmons
Date published: September 9th 2016
Table of Contents
Introduction
For those wanting a large ‘4K’ UHD screen that still offers an excellent pixel density and an unmistakable ‘UHD’ feel to content, ~32” is a nice screen size to go for. Unfortunately, those users who prefer the strong contrast of VA (Vertical Alignment) panels had no UHD monitor options that were any smaller than 40”. The AOC U3277PWQU sets things straight by offering a 31.5” UHD screen with a VA panel type. We put this model through its paces and find out how it performs in a range of ‘real world’ testing scenarios, including games and movies.
Specifications
A 60Hz 31.5” VA (Vertical Alignment) type panel is used, or more specifically a rather confusingly named AAS (Azimuthal Anchoring Switch) panel. This sports a 3840 x 2160 (‘4K’ UHD) resolution and 10-bit colour processing. A static contrast ratio of 3000:1 is specified alongside a 4ms grey to grey response time. As usual, these figures should be approached with caution – particularly the specified response time. Some of the key ‘talking points’ of the monitor have been highlighted in blue below.
The key ‘talking points’ of the specification have been highlighted in blue below.
Features and aesthetics
From the front the monitor has a smart homely look to it. The bezels are rather thick at ~20mm (0.79 inches) at the top and sides and ~26mm (1.02 inches) at the bottom. There is no substantial panel border either, as it is covered by the bezel (i.e. this is not a ‘dual-stage’ bezel design). The bottom bezel and indeed the face of the stand base is brushed metal, which gives the product a nice premium look and feel in these areas. The screen surface is relatively light matte anti-glare, as we explore later.
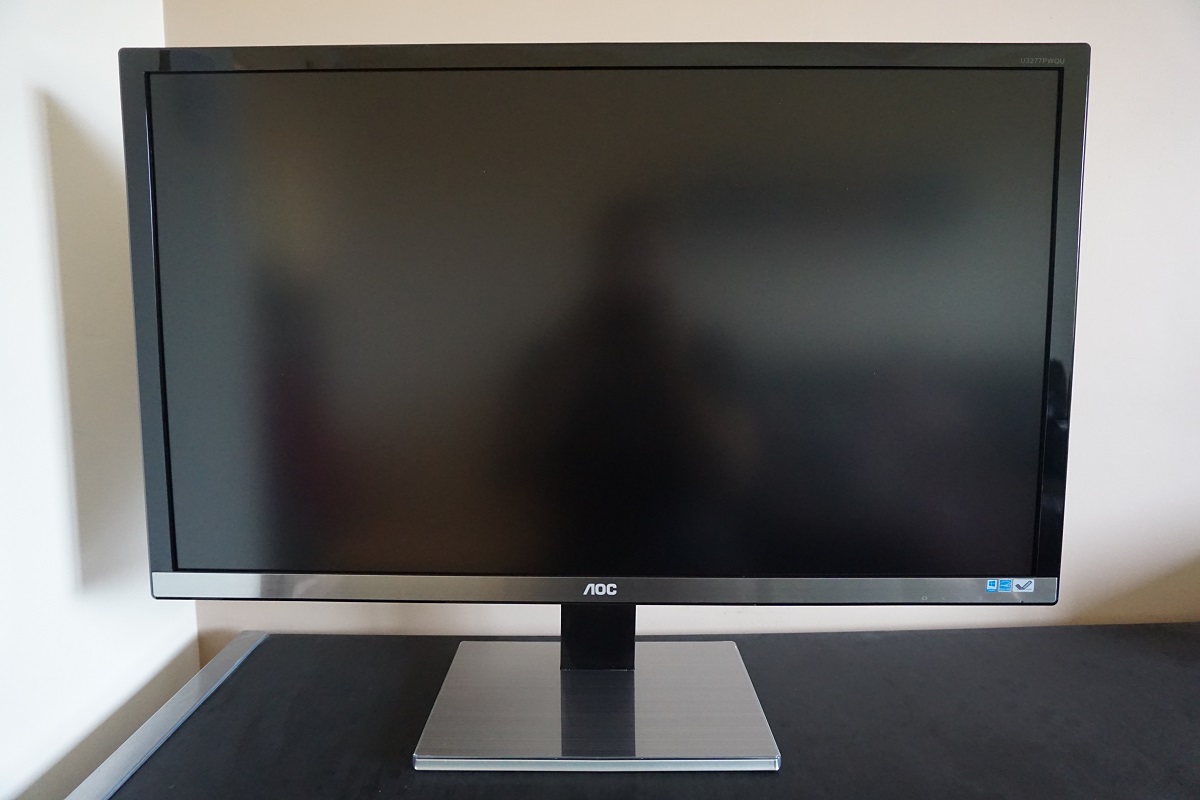
The OSD (On Screen Display) is controlled by pressable buttons on the underside of the bottom bezel, towards the right. There is a small forwards-facing power LED here as well, which glows blue when the monitor is on and red when it is in a low power state (i.e. no signal is received from the computer). If you turn the monitor ‘off’ using the power button (technically still standby) then the light also turns off. The video below shows the functionality of the OSD menu system.
From the side the monitor appears reasonably thin towards the edges (~24mm or 0.94 inches) but bulks out more centrally and where the stand attaches. The included stand offers full ergonomic; tilt (5° forwards, 24° backwards), height adjustment (180mm or 7.08 inches), swivel (165° left, 165° right) and pivot (90° clockwise rotation). This level of height adjustment is particularly impressive. At the right side of the screen there are are 2 USB 2.0 ports and 2 USB 3.0 ports (plus upstream). The blue-coloured port is USB 3.0, the yellow-coloured port is USB 3.0 with fast-charging and the black-coloured ports are USB 2.0.
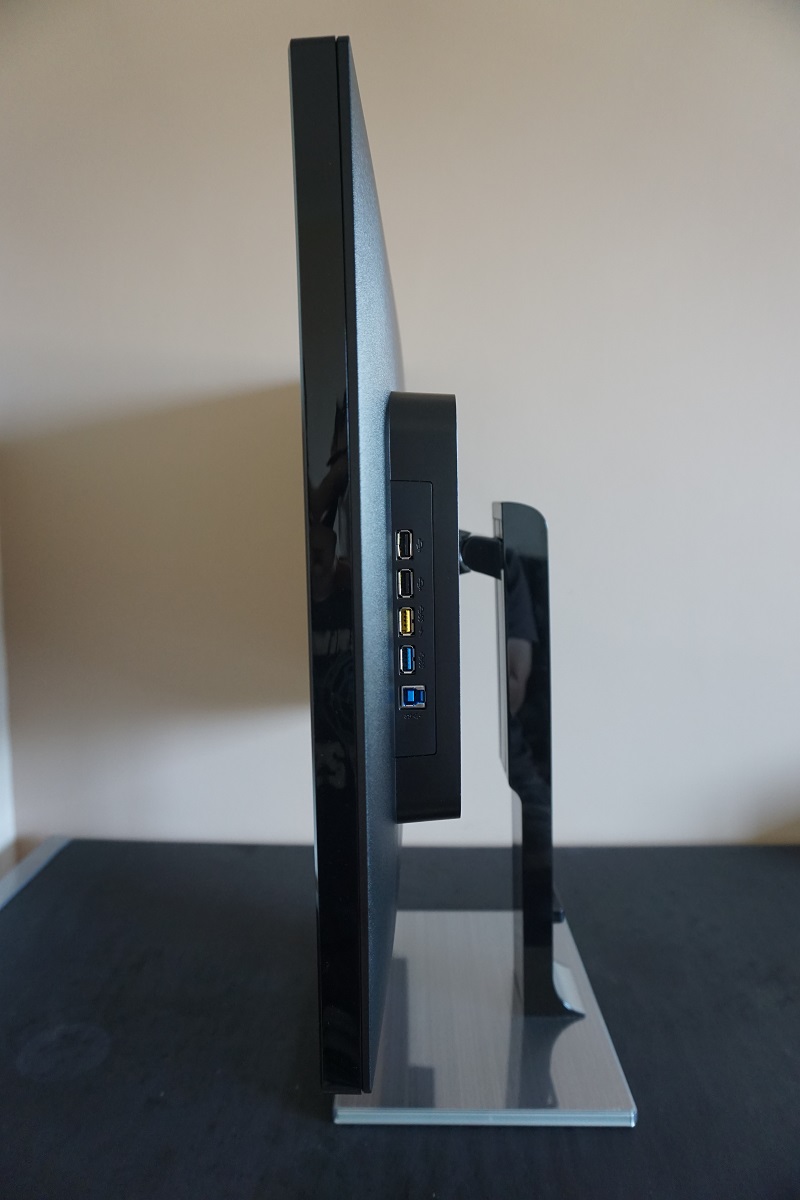
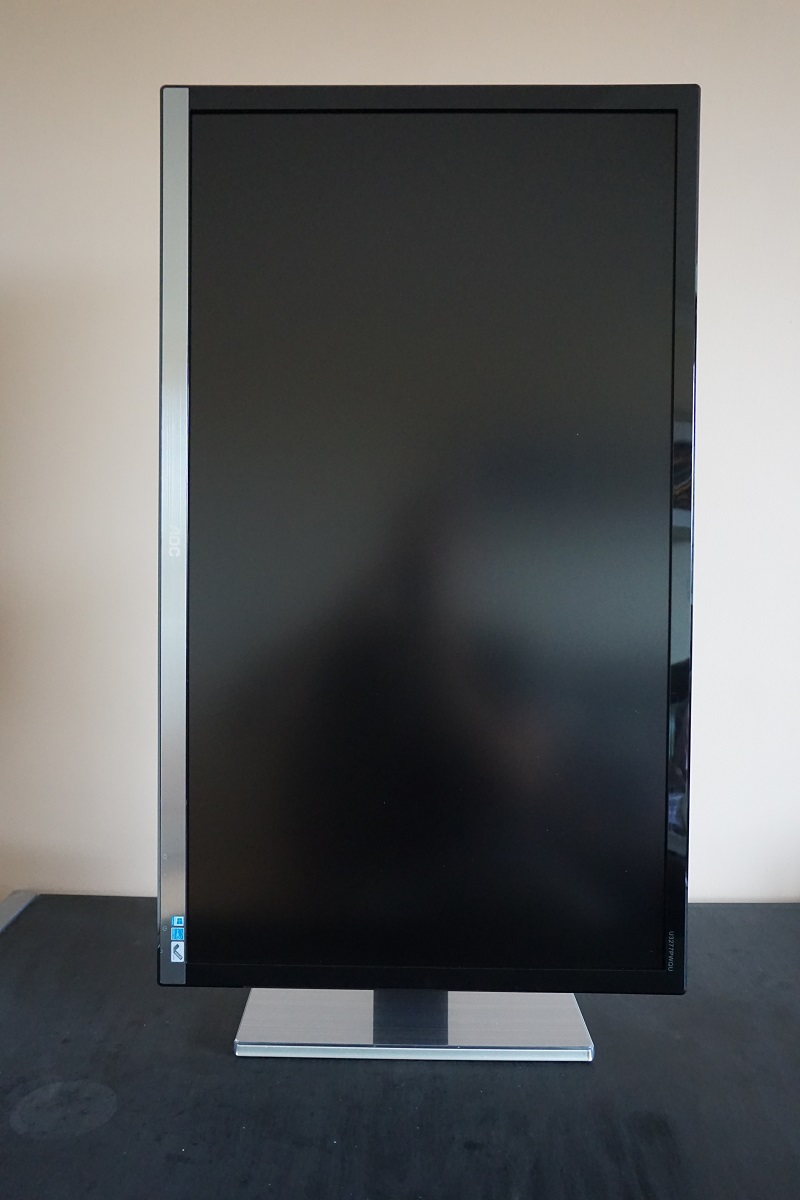
The stand neck and joint with the screen is not as solid as on some fully adjustable monitors, although wobbling of the screen is not excessive and we don’t fear that the stand will give way under the weight of the screen or anything. The total depth of the monitor including stand is ~290mm (11.42 inches) with the screen pretty much in-line with the front edge of the stand base. This therefore brings the screen a bit closer to your eyes than you might like if your desk isn’t particularly deep and you have it pushed up against a wall. At lowest height the bottom edge of the screen clears the desk by ~48mm (1.89 inches) with the top edge ~487mm (19.17 inches) clear of the desk surface.
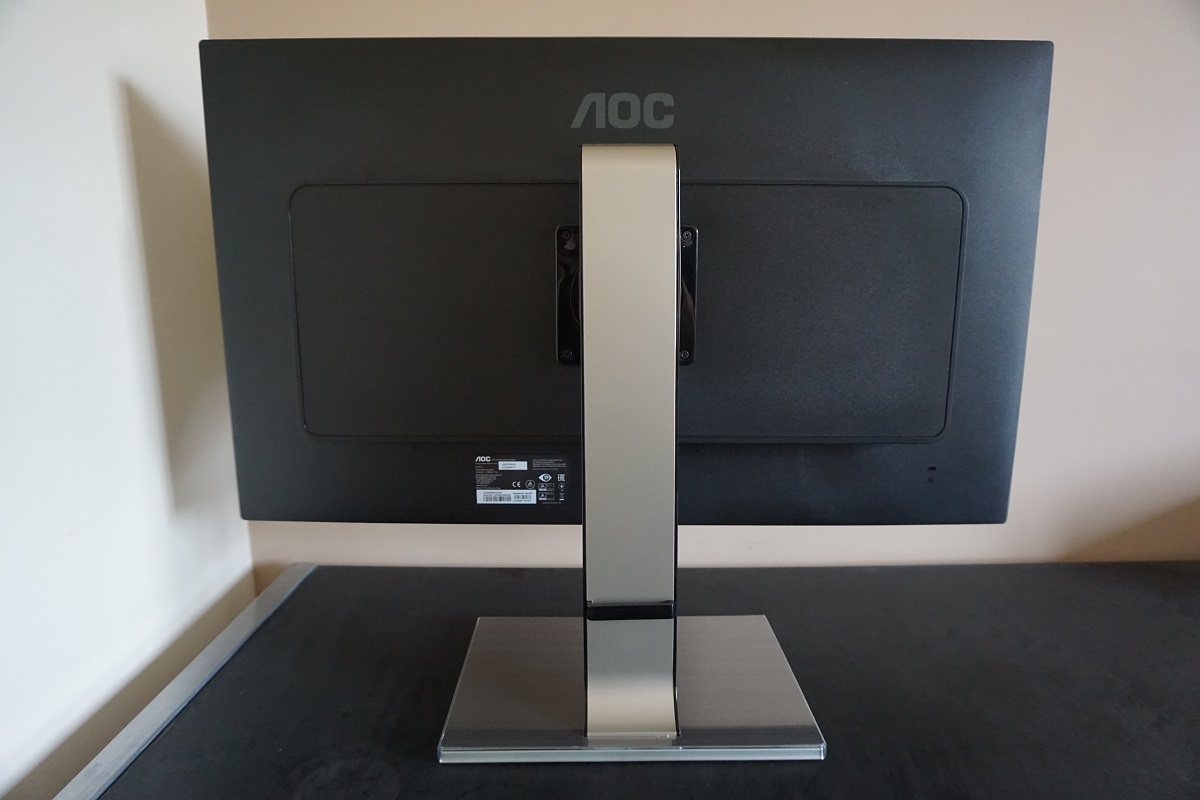
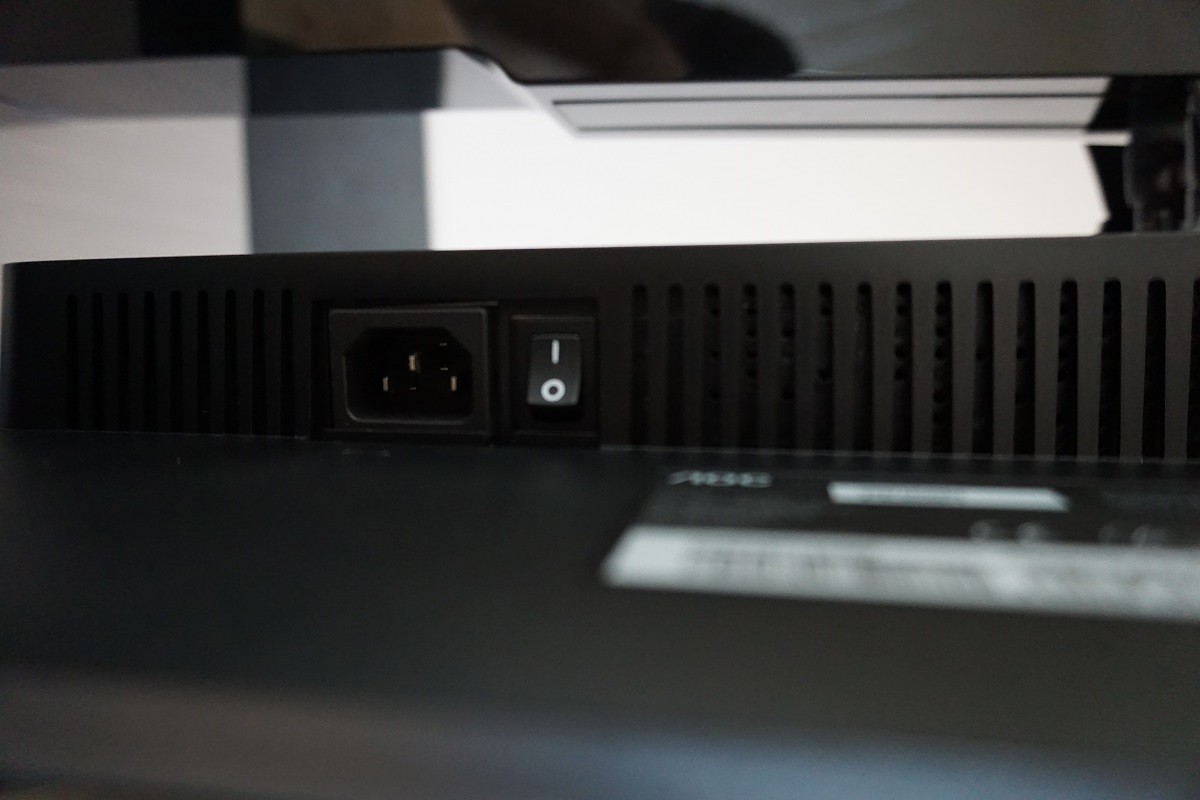
The rear of the monitor is matte black plastic with a foil texture, with the exception of matte silver plastics used at the rear of the stand neck and some glossy black plastics at the side of the stand neck. As noted earlier the stand base has a brushed metal face – matte silver plastic is used elsewhere on the stand base. There 100 x 100mm VESA holes centrally, to which the included stand mounts. It can be unscrewed to make way for an alternative stand or mount. There is a K-Slot towards the bottom right of the screen, whilst towards the bottom of the stand neck there is a small cable-tidy clip. The ports of the monitor face downwards, which is helpful if you wish to wall-mount the display. To the left of the stand neck is an AC power input (internal power converter) and a zero-watt power switch to completely shut power off to the monitor. To the right are the remaining ports; Dual-Link DVI, HDMI 2.0 (with MHL), DP 1.2, VGA, 3.5mm audio input and a 3.5mm headphone jack. There are also integrated 3W speakers, which provide basic (but not particularly high quality) sound output with decent volume.
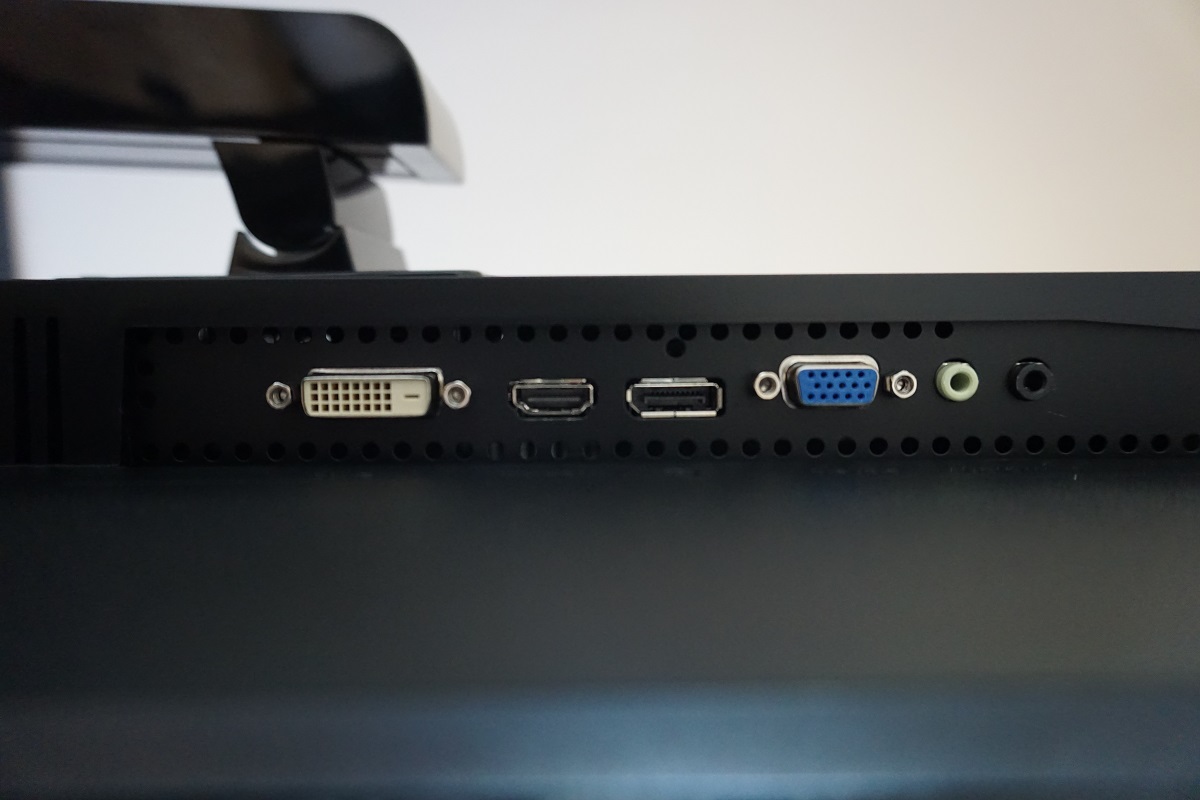
The monitor supports 3840 x 2160 @ 60Hz via either HDMI 2.0 or DP 1.2. The standard cabling included with the monitor is generous as it includes; a power cable, DisplayPort cable, HDMI cable, USB 3.0 cable, 3.5mm audio cable and VGA cable.
Calibration
Subpixel layout and screen surface
The monitor uses a relatively light matte anti-glare screen surface. This is not as light (low haze) as that used on ~32” models with IPS-type panels, nor smaller UHD models with IPS-type panels. It is the same screen surface found on the 28” TN models, whose panels are also manufactured by Innolux. The surface texture is not as smooth, either. As a result, white and other light shades have a bit of a grainy look to them, although not in the heavy/smeary way observed on some screen surfaces. It’s more of a light mist of graininess, the results of which are explored later on. Although this can potentially reduce the vibrancy potential a bit compared to lighter matte solutions, that isn’t something that this monitor is short on given the colour gamut.
![]()
The standard RGB (Red, Green and Blue) stripe subpixel layout is used. This is the standard subpixel layout and is the one ‘expected’ by operating systems such as Microsoft Windows and Apple’s MacOS. Windows users needn’t worry about ClearType whilst Mac users don’t need to worry about text-fringing issues that can be caused by less conventional subpixel layouts. Windows users may still wish to run through the ClearType wizard to adjust according to preferences, however.
Testing the presets
This monitor has a range of settings that can be configured in the OSD (On Screen Display), although it avoids using ‘presets’ in the traditional sense. There are a number of ‘Eco Mode’ settings, but these just adjust the brightness to various preset values. The exception there is the ‘Uniformity’ setting, a uniformity compensation setting that we explore later on in the review. We test this setting alongside various other setting combinations in the OSD. The table below includes key readings (gamma and white point) taken using a DataColor Spyder5ELITE colorimeter alongside some general observations. The monitor was left in its ‘Plug and Play’ state, connected to a Windows 10 PC without any additional monitor drivers or ICC profiles installed. The test system used an Nvidia GTX 1070 connected by DP 1.2, although our observations using HDMI 2.0 were very similar. The monitor was left to run for over 2 hours before readings were taken. It should be assumed that any setting not mentioned was left at default.
| Monitor Settings | Gamma (central average) | White point (kelvins) | Notes |
| Gamma1 (Factory Defaults) | 2.2 | 7257K | The image is bright and very vibrant, with strong saturation. Some shades appear quite ‘overblown’, particularly reds, oranges and greens when considering normal sRGB content. This is primarily down the wide colour gamut of the monitor, as explored later. Due to the gamma shifts associated with the VA panel type, some saturation is lost further down the screen and towards the flanks – but even here saturation is excessive in places. The image also appeared rather cool with a mild green tint. |
| Gamma2 | 2.0 | 7278K | As ‘Gamma1’ but a little less depth in places – oversaturation was still rife for normal sRGB content, however. |
| Gamma3 | 2.3 | 7286K | As ‘Gamma1’ but extra depth in places – not a huge difference overall, though. |
| Color Temp. sRGB | 2.2 | 7024K | This is an sRGB emulation mode, but as explored later restricts the colour gamut massively (more than it ideally would). Things look dusty and quite washed-out, not just compared to settings which use the native gamut but also compared to most standard gamut (~sRGB) models. |
| Eco Mode Uniformity | 2.2 | 7377K | As factory defaults but gamma tracking adheres more closely to ‘2.2’ and the uniformity compensation feature is active (as explored later). Image remains bright and vibrant, with a cool tint. Note that the ‘Color Setup’ adjustments can also be made in this mode, although it is designed to work optimally using the factory default ‘Warm’ setting. |
| Test Settings (see below) | 2.2 | 6488K | The cool tint has been neutralised due to better white point balancing. Brightness has also been lowered significantly. This provides a better balance to the image overall, but things remain looking highly vibrant and saturated. |
| Relaxing evening viewing (see below) | 2.2 | 4971K | As ‘Test Settings’ in terms of OSD setup, but the blue colour channel is lowered significantly. This acts as a Low Blue Light (LBL) setting, giving a warm look to the image that is suitable for relaxing evening viewing. |
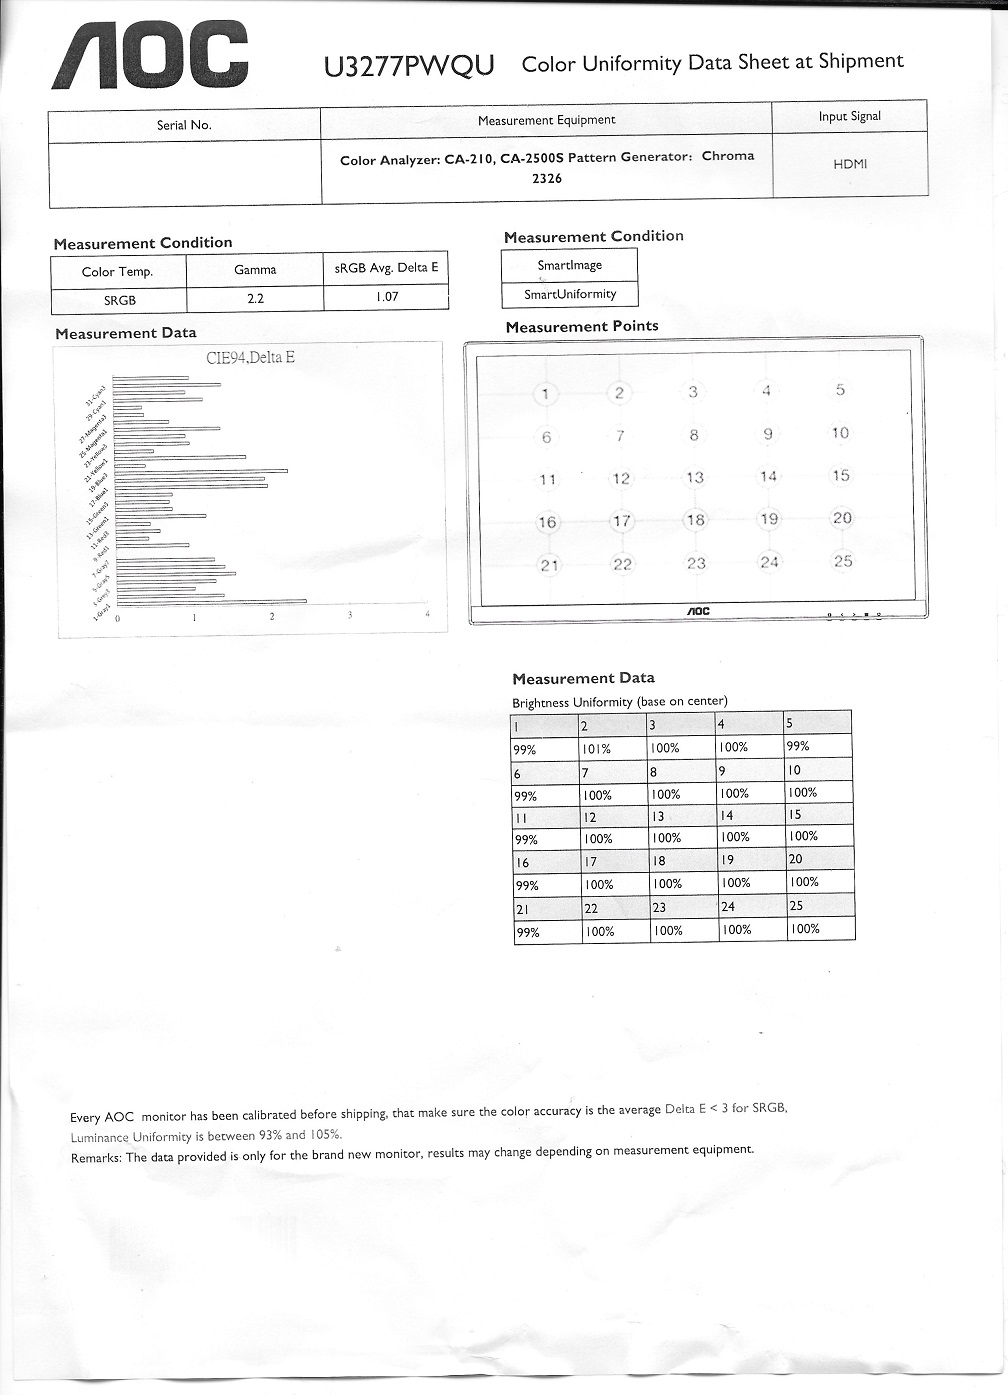
Out of the box the monitor provided a highly saturated and very vibrant image, with a cool tint. A far from ideal setup as far as accurate colour reproduction goes, but at least partially correctable with a bit of manual tweaking. A factory calibration report is included, showing how the monitor conforms to certain standards with ‘Color Temp.’ set to ‘sRGB’. An analysis of uniformity is also provided with the monitor using the’ Uniformity’ uniformity compensation setting, a special ‘EcoMode’ preset. As with the U2477PWQ which also features this mode, it is incorrectly labelled ‘SmartUniformity’ on the report. This is a feature found on certain Philips monitors, and given the considerable crossover between both companies is an understandable error. The ‘sRGB’ setting certainly cut down on a lot of the native oversaturation, but unfortunately went too far and trimmed things down so they appeared dusty and washed-out; lifeless, in many respects.
The monitor’s gamma tracking was decent out of the box. It tracked at 2.2 on average according to the colorimeter, but as you can see below bowed a bit centrally. This meant that some shades appeared slightly lighter than they should – but this was hardly noticeable given the heavy saturation imposed by the colour gamut. And perceived gamma changes were also in effect due to the panel type, as we explore later. The sRGB setting improves conformity to the ‘2.2’ curve somewhat, although the tracking still isn’t perfect. It comes closest to the curve using the ‘Uniformity’ setting. The images below show the gamma tracking under out ‘Test Settings’, the ‘sRGB’ setting and ‘Uniformity’ setting, respectively.
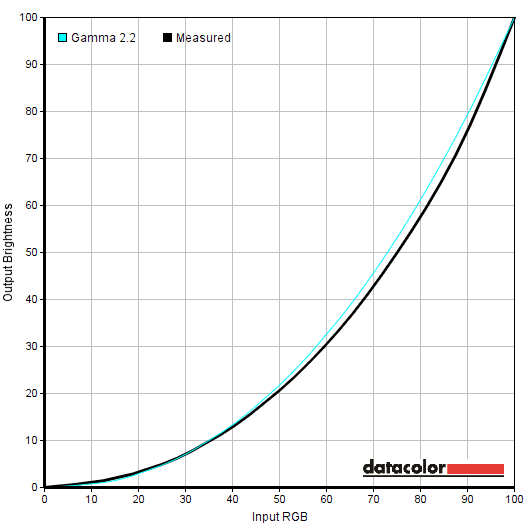
Gamma 'Test Settings'
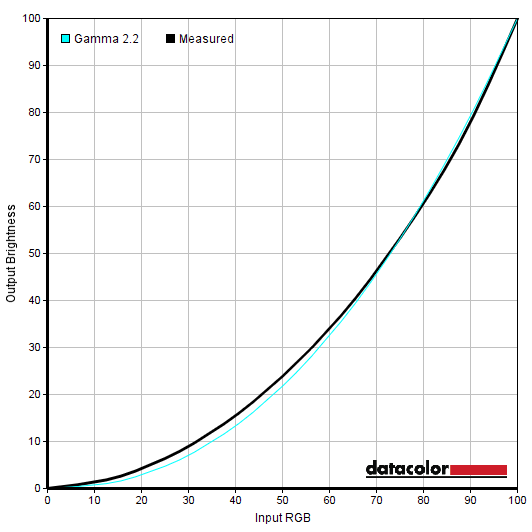
Gamma 'sRGB'
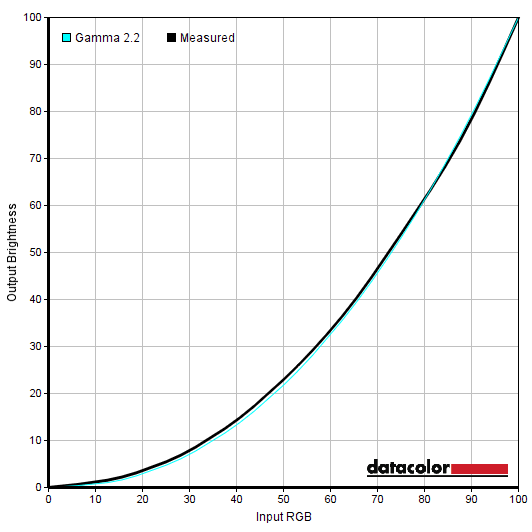
Gamma 'Uniformity'
Test Settings
For our ‘Test Settings we set ‘Color Temp’ to ‘User’ and made various adjustments to the colour channels, to improve the white point and get rid of the cool tint. We also reduced the brightness significantly. These settings are only a suggestion and applied to our unit. Be aware of inter-unit variation – they won’t necessarily be optimal for all units. Any setting not mentioned below was left at default. We’ve also included the ‘Overdrive’ setting used in the review, for reference, even though this was left at the default setting. Overdrive= Off Color Temp.= User R= 50 G= 46 B= 41
Brightness= 65 (according to preferences and lighting)
Relaxing evening viewing
This monitor lacks a dedicated ‘Low Blue Light’ (LBL) setting or preset to that effect, so we created our own using manual colour channel adjustments. For the sake of simplicity everything was kept as per the ‘Test Settings’, with the exception of the blue colour channel which was reduced a lot more. We used these settings for our own viewing pleasure later in the evening but not for any of our testing. Brightness= 65 (according to preferences and lighting) Overdrive= Off Color Temp.= User R= 50 G= 46 B= 10
Contrast and brightness
Contrast ratios
A BasICColor SQUID 3 (X-Rite i1Display Pro) was used to measure the white and black luminance using a range of settings. From these values static contrast ratios were calculated, as shown in the following table. Here, black highlights indicate the highest white luminance, lowest black luminance and highest contrast ratio. Blue highlights indicate the results under our ‘Test Settings’ and ‘Relaxing evening viewing’ settings. Assume any settings not mentioned were left at default, with the exceptions previously mentioned in the calibration section.
| Monitor Settings | Gamma (central average) | White point (kelvins) | Notes |
| 100% brightness | 275 | 0.11 | 2500 |
| 80% brightness | 226 | 0.09 | 2511 |
| 60% brightness | 175 | 0.07 | 2500 |
| 40% brightness | 127 | 0.05 | 2540 |
| 20% brightness | 82 | 0.03 | 2733 |
| 0% brightness | 34 | <0.02 | >1700 |
| Factory defaults (90% brightness) | 251 | 0.10 | 2510 |
| Gamma2 | 249 | 0.10 | 2490 |
| Gamma3 | 248 | 0.10 | 2480 |
| Color Temp. sRGB | 245 | 0.10 | 2450 |
| Eco Mode Uniformity | 202 | 0.10 | 2020 |
| Test Settings | 176 | 0.08 | 2200 |
| Relaxing evening viewing | 170 | 0.08 | 2125 |
With only brightness adjusted, excluding at ‘0’ brightness where the black luminance was too low to accurately measure, the average static contrast was 2571:1. This falls a bit short of the specified 3000:1, but is still strong and firmly within ‘VA only’ territory as far as LCD panels are concerned. With the moderate adjustments made to our ‘Test Settings’, contrast fell to a still reasonable 2200:1. With the more significant adjustments made to the ‘Relaxing evening viewing’ settings contrast only dropped a little further, to 2125:1. Despite looking lacklustre in other respects, contrast remained strong (2450:1). The lowest contrast ratio was yielded using the ‘Uniformity’ Eco Mode; 2020:1, which is still good. The highest white luminance recorded was 275 cd/m², whilst the lowest white luminance recorded on this table was 34 cd/m². This provides a 241 cd/m² luminance adjustment range with a good range of useful values.
A Dynamic Contrast setting known as ‘DCR’ (Dynamic Contrast Ratio) features on this monitor. Various settings such as brightness and colour adjustment settings are locked out when this setting is active. However; it actually respects the values you set the monitor to before activating ‘DCR’. This means you can, for example, limit the maximum brightness that will be used with this setting. ‘DCR’ allows the backlight brightness to adjust according to the levels of ‘dark’ and ‘light’ on the screen at any one time, with the backlight dimming or brightening as one single BLU (Backlight Unit). The almost hidden flexibility offered by AOC here actually makes this setting one of the better Dynamic Contrast modes we’ve come across. Still, we much prefer manual control of the backlight brightness and feel that dimming or brightening the entire screen based on average image brightness is a compromise at best.
PWM (Pulse Width Modulation)
The monitor does not use PWM (Pulse Width Modulation) to regulate backlight brightness at any level. Instead, DC (Direct Current) modulation is used. The backlight is therefore considered flicker-free, which will come as welcome news to those worried about visual fatigue or other potential side-effects from PWM usage.
Luminance uniformity
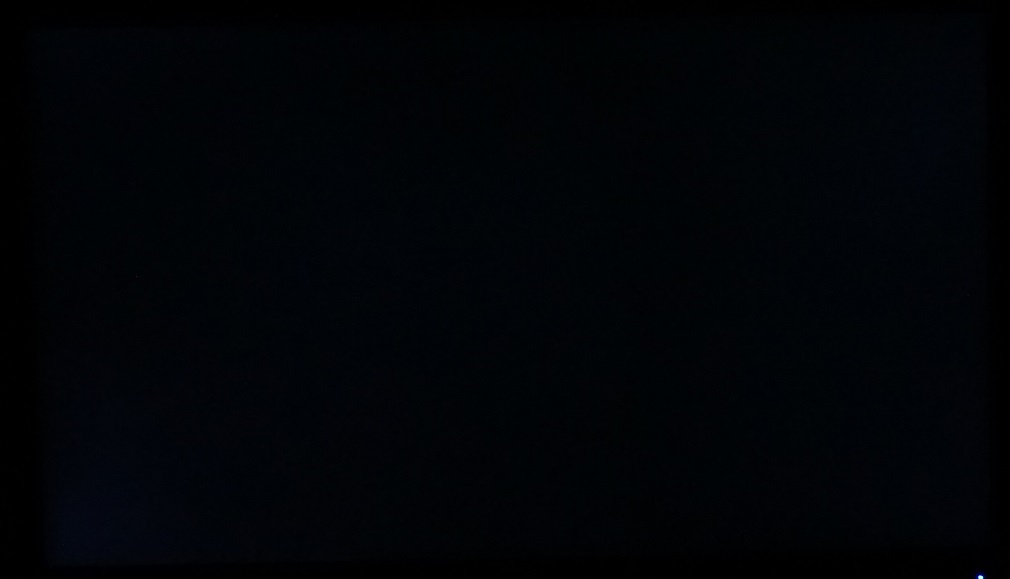
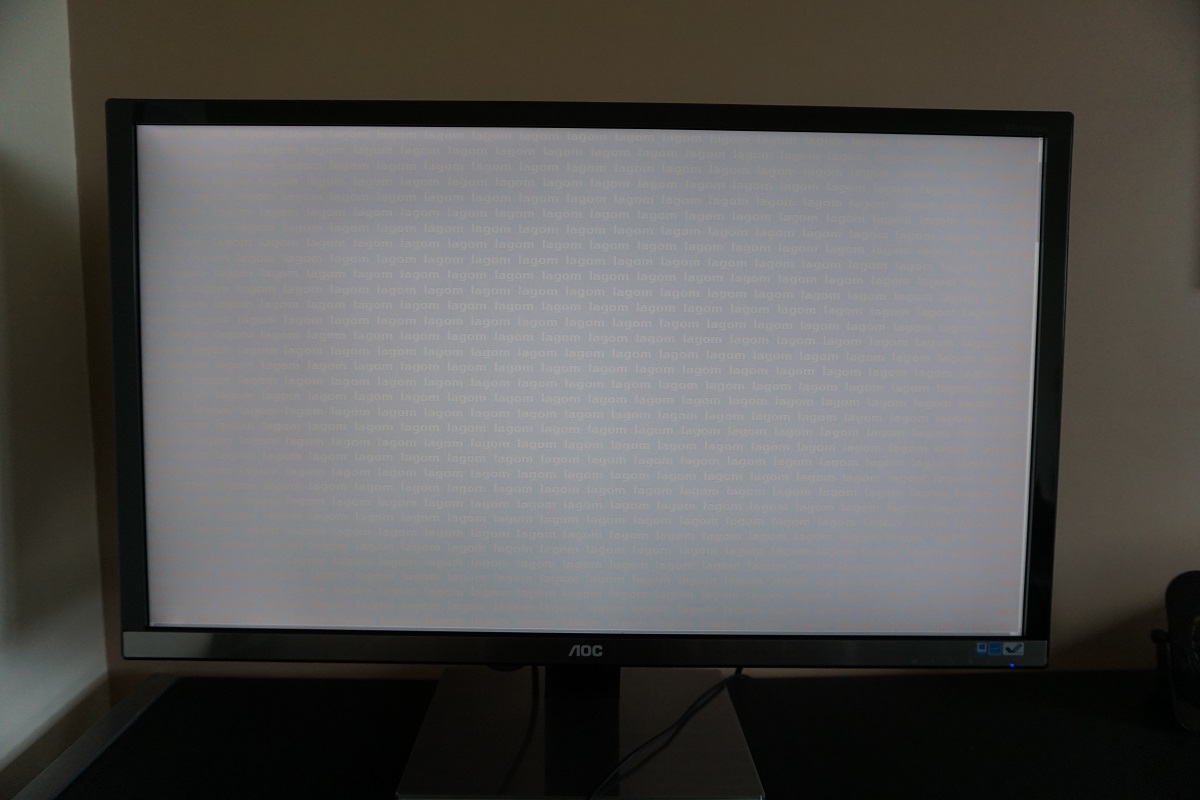
Whilst observing a black background in a dark room, we could see slight backlight bleed towards the bottom left corner of the screen. There was also some minor clouding in this region, and to a lesser extent other regions of the screen. Note that individual units can vary when it comes to backlight bleed, but VA models such as this are regarded as the best LCD light blockers so tend to be relatively strong in this respect. The image below was taken from a few metres back to eliminate ‘VA glow’, which is a silverish-purple glow that can be observed towards the bottom corners in particular from a normal viewing position. It becomes more noticeable from sharper viewing angles, as demonstrated in a video later on in the review. Regardless of viewing position it is not as obtrusive or noticeable as ‘IPS glow’
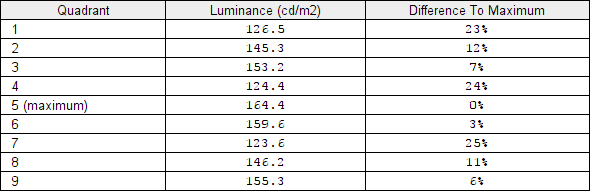
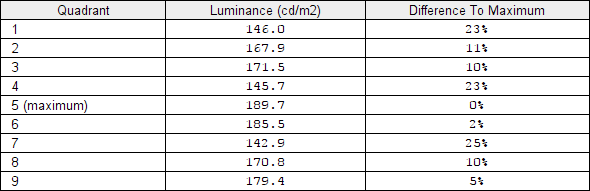
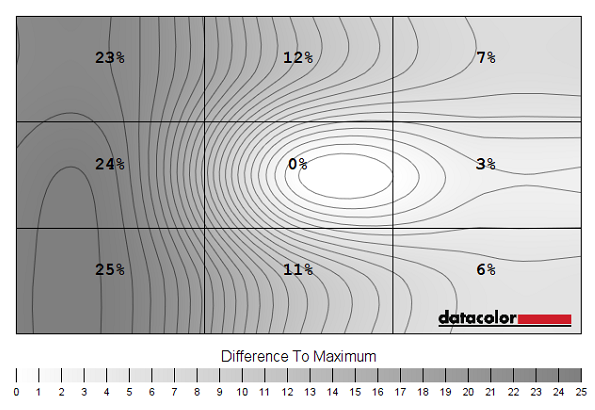
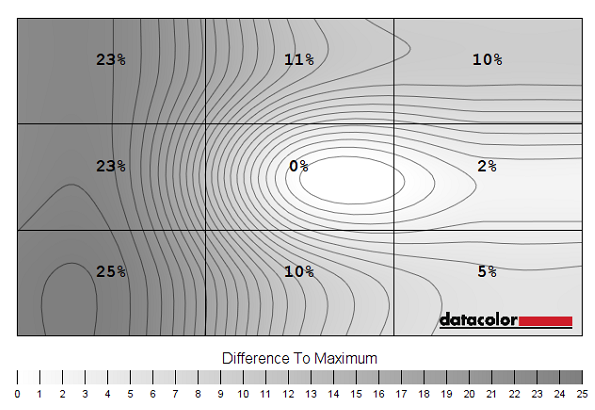
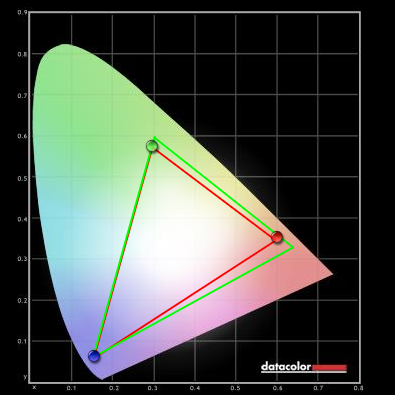
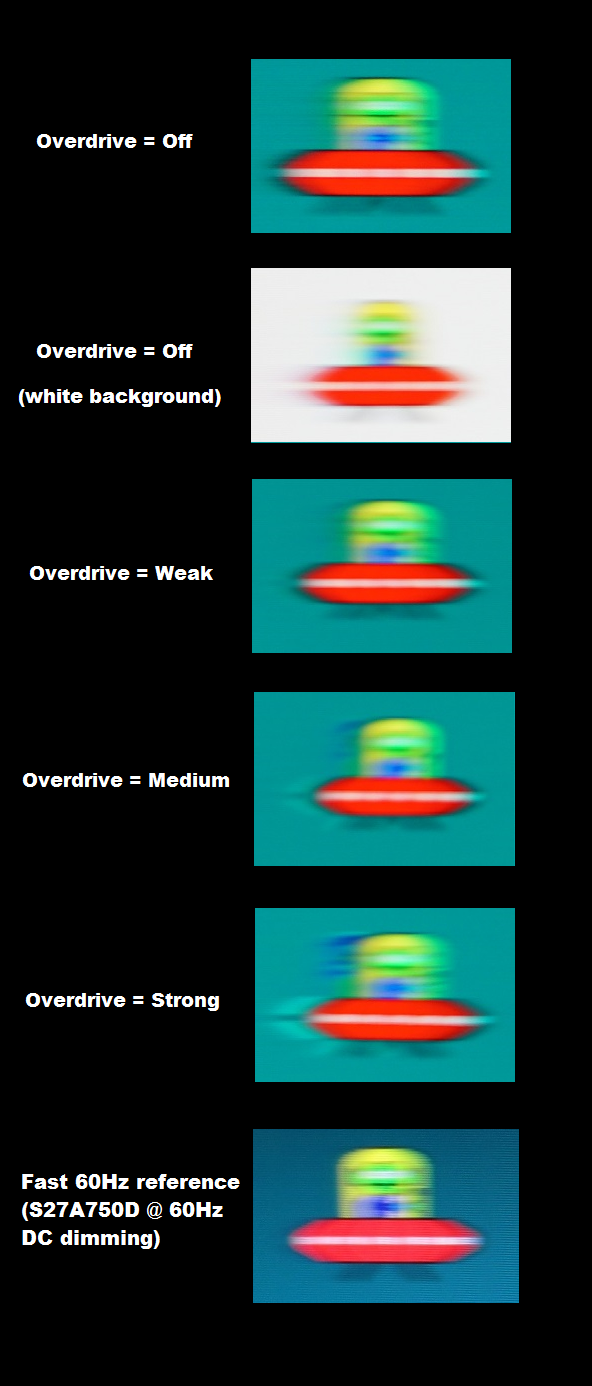
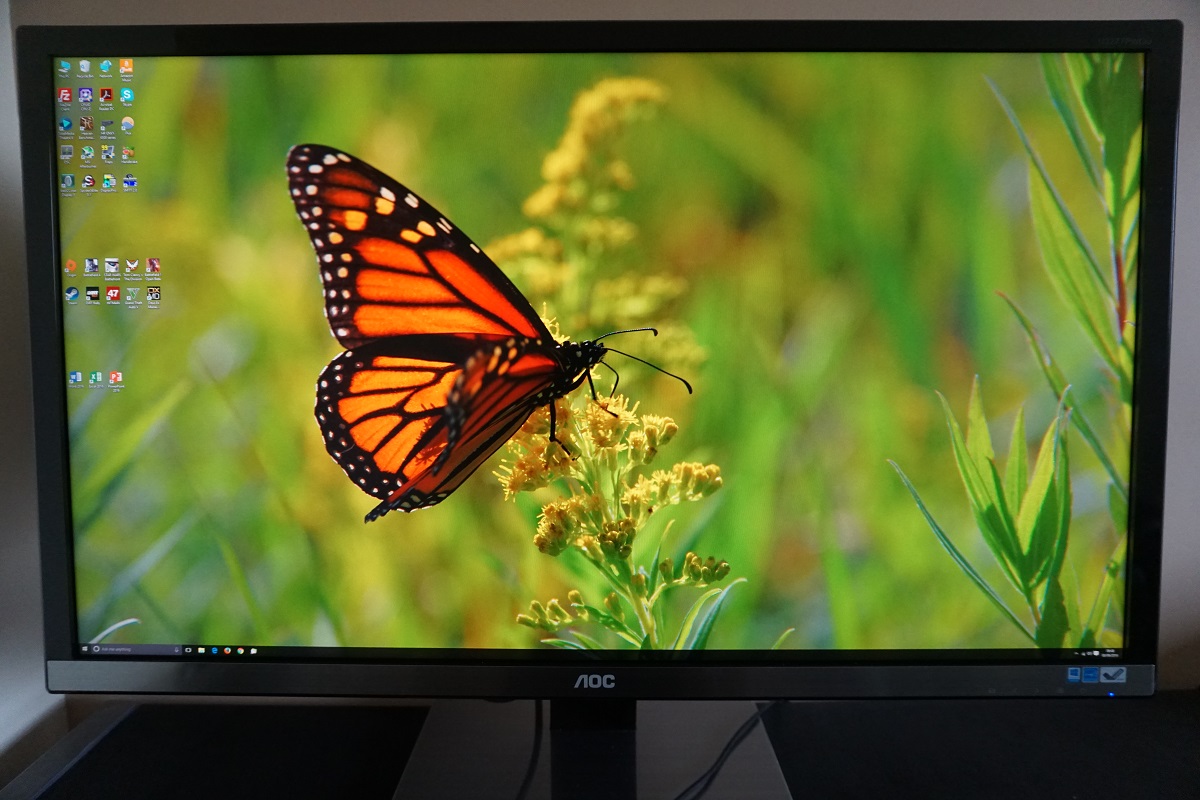
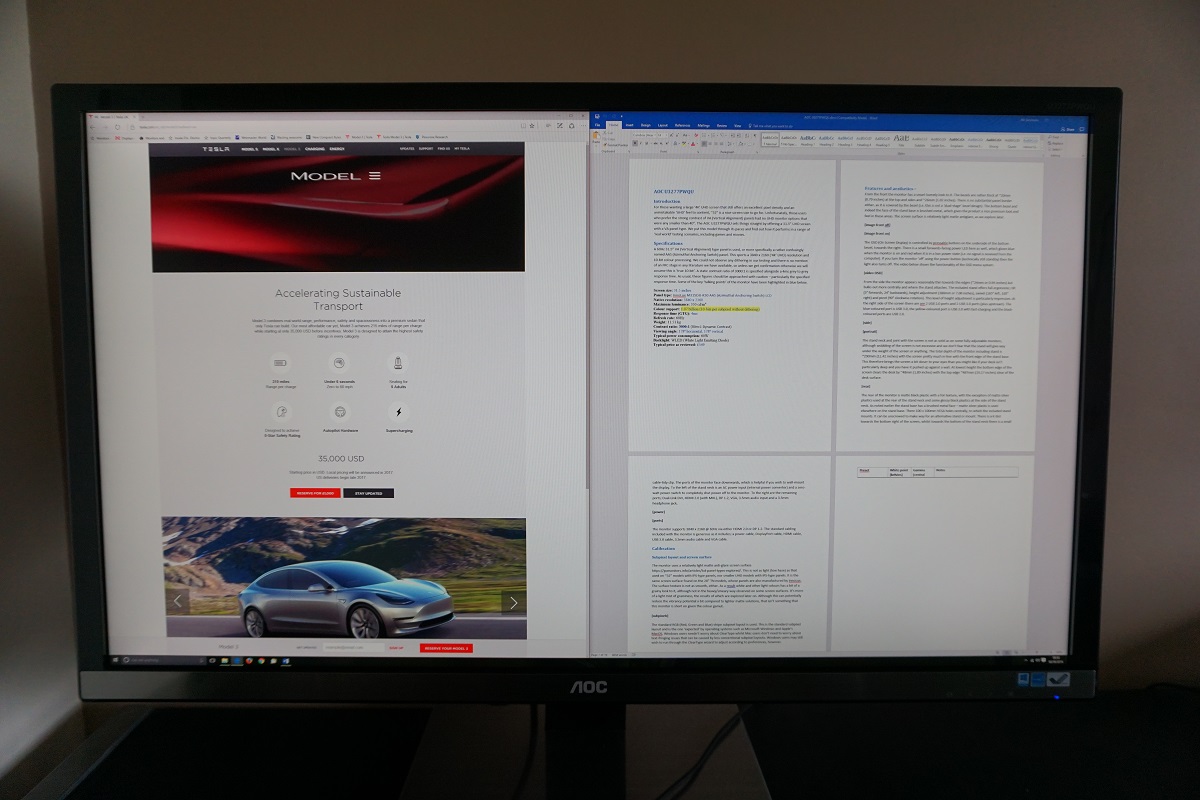
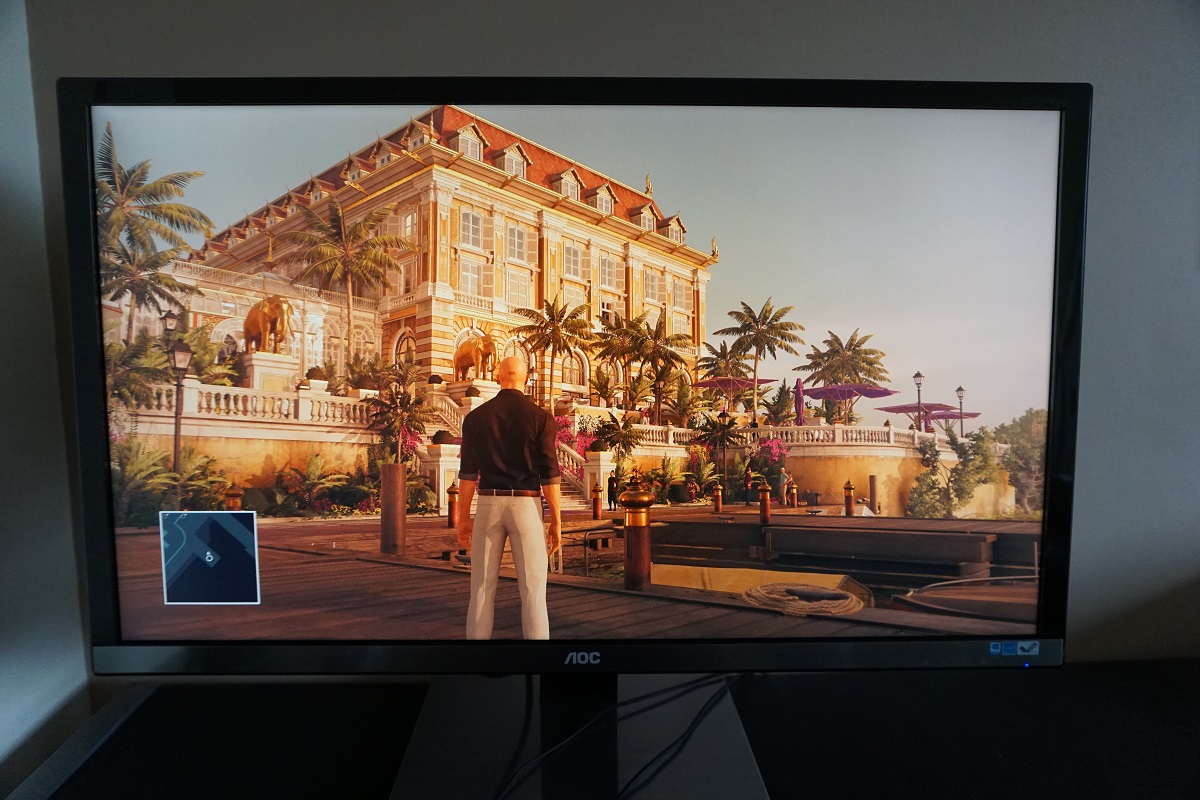
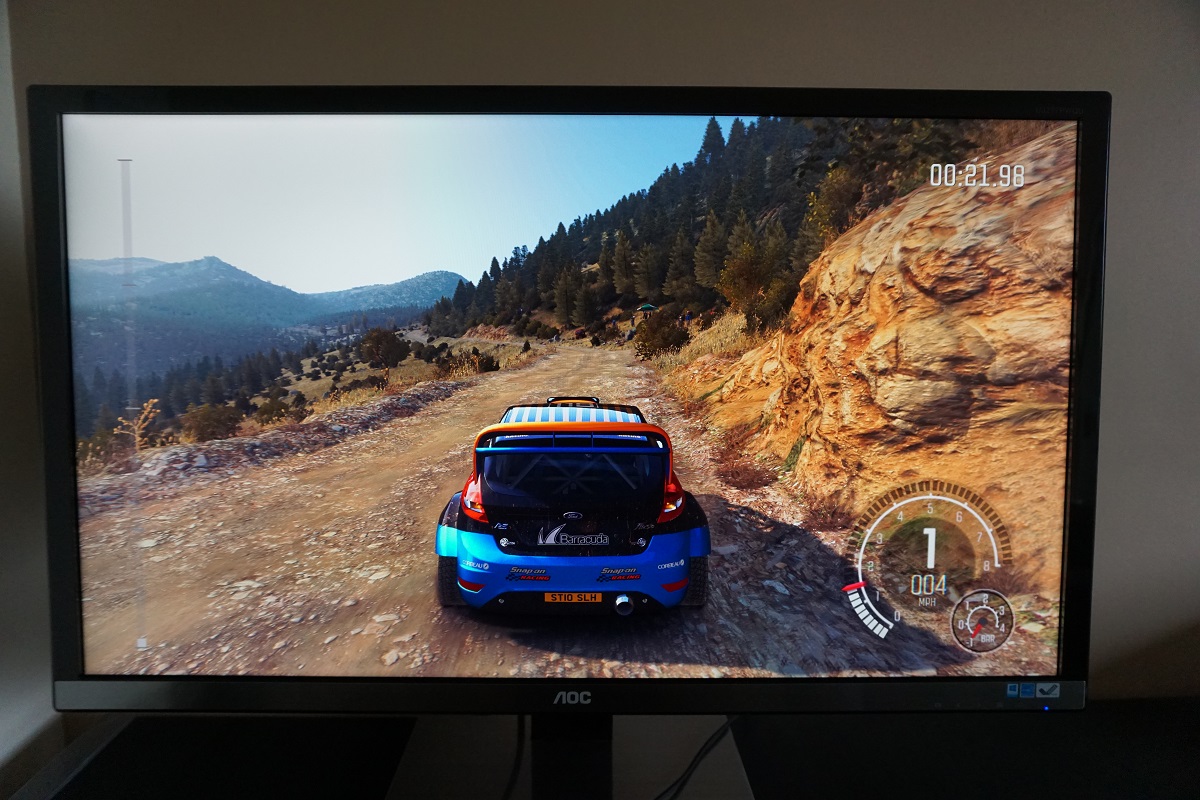
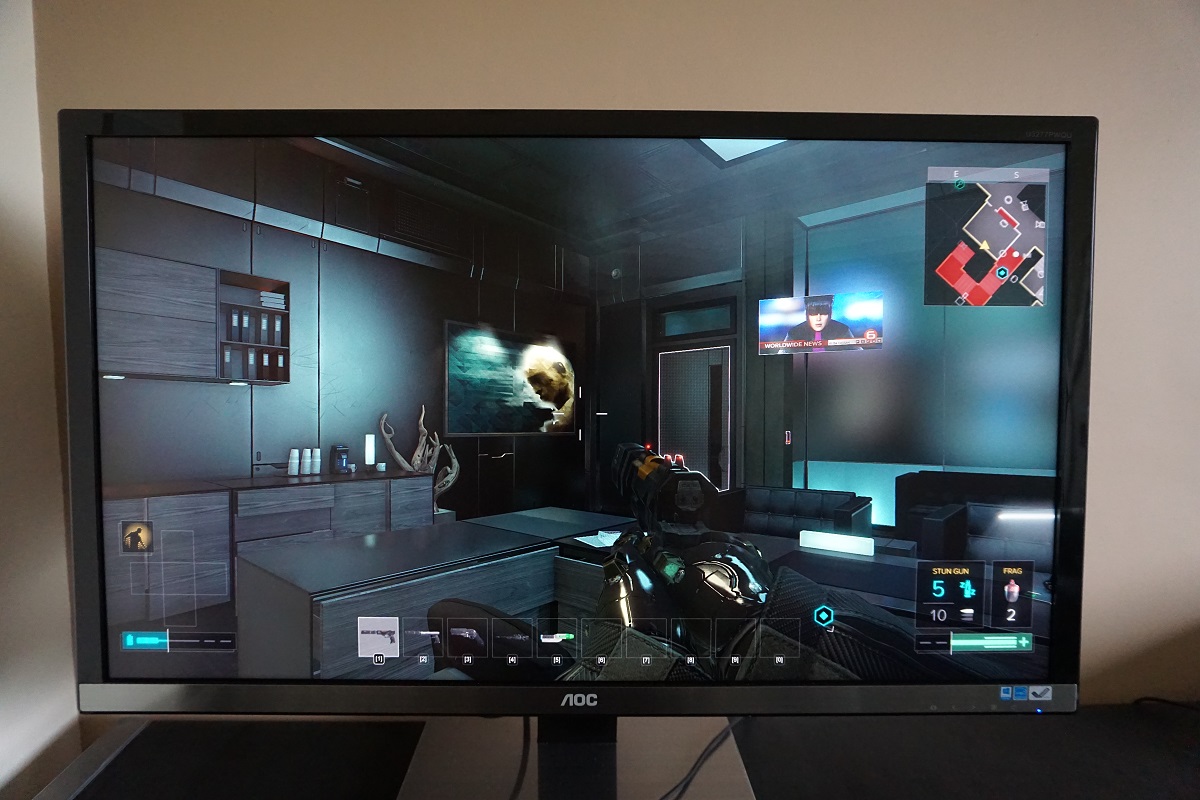
The Spyder5ELITE was used to assess the uniformity of lighter colours, specifically by analysing the luminance of 9 equidistant white quadrants running from the top left to bottom right of the screen. The luminance of each quadrant was measured and compared to the brightest quadrant measured. The tables below shows these readings alongside the percentage deviation between each quadrant at the brightest recorded point. The first table shows the results using our ‘Test Settings’ and the second table shows the results using the ‘Uniformity’ setting. This is a factory-tuned uniformity compensation setting which is designed to enhance uniformity at the expense of contrast (as supported by our previous findings). Under our ‘Test Settings’, the luminance uniformity was variable, quite poor overall. The brightest point recorded was ‘quadrant 5’ at the centre of the screen (164.4 cd/m²). The maximum deviation occurred at ‘quadrant 7’, towards the bottom left (123.6 cd/m², which is 25% dimmer). The average uniformity deviation between each quadrant and the brightest point was 13.63%. Using the ‘Uniformity’ setting made little difference really. The brightest point remained ‘quadrant 5’ at the centre of the screen (189.7 cd/m²). The maximum deviation from this was again 25% at ‘quadrant 7’ (142.9 cd/m²) with an average deviation of 13.63%. It really seems as if the ‘Uniformity’ setting did very little, it certainly didn’t improve uniformity overall and the same problem areas on the screen remained. We also tested using HDMI, but this yielded no improvement. We’ve included some contour maps below to give a graphical representation of these deviations. Here darker greys represent lower luminance (greater deviation from brightest point) than lighter greys. The top map uses our ‘Test Settings’ whereas the bottom map uses the ‘Uniformity’ setting. The percentage deviation between each quadrant and the brightest point is also given. Note that individual units can vary when it comes to uniformity both with and without this setting active and that there may be further deviation beyond the measured points. For those who prefer a graphical representation, the contour maps below shows these deviations with darker greys representing lower luminance (and hence greater deviation from the brightest point) than lighter greys. The percentage deviation between each quadrant and the brightest point is also shown. The Spyder5ELITE was also used to analyse variation in the colour temperature (white point) for the same 9 quadrants previously analysed. The deviation between each quadrant and the 6500K (D65) daylight white has been assigned a DeltaE value, where a DeltaE <3 represents non-significant deviation that most users wouldn’t readily notice by eye. As before, the top map shows the results under our ‘Test Settings’ and the second using the ‘Uniformity’ setting. Darker shades on this contour map indicate higher deviation from 6500K than lighter shades. Under our ‘Test Settings’ colour temperature uniformity was good overall. There was significant deviation between the point closest to 6500K (right of centre) and the point furthest from this value (bottom left, with a DeltaE of 3.6). Elsewhere deviations were not recorded as significant, although the top left was pretty much borderline at a DeltaE of 2.9. Activating the ‘Uniformity’ setting certainly changed things, but not in a good way. The maximum deviation rose to a DeltaE of 5.0 (top right), with 3 adjoining regions also showing significant deviation. Note that individual units can vary when it comes to colour temperature uniformity, there may be deviation beyond the measured points and that the viewing angle characteristics of this panel type give some perceived differences that can’t be measured. Either way, it seems that the ‘Uniformity’ setting is simply counter-productive and doesn’t work as it should. Contrast performance was strong overall on the Battlefield 1 beta. Whilst this title was limited in its range of lighting conditions, due to being restricted to a single map, it still allowed good assessment of the strengths and weaknesses related to contrast on the monitor. Dark elements and subtle details such as cracks in rocks and the ground stood out very nicely against the surrounding lighter shades. This helped give objects a nice definition which complimented the high pixel density nicely. The level of detail in darker areas was largely as it should be, although there was a degree of ‘black crush’ towards the central area of the screen. This is where dark shades that should be displayed as a bit lighter than black (i.e. not extremely dark) are actually indistinct from black and essentially blend into black. This did not occur to a huge degree but was somewhat more pronounced than we’ve seen on some other VA models recently, including AUO ‘AMVA+’ panels and Samsung curved ‘SVA’ panels. Brighter elements such as the sky, muzzle flashes and indeed the desert sand appeared slightly grainy (appropriate in the last case – but not intended in this way). This was due to the screen surface texture, which wasn’t as smooth as we would have liked. Although it was still free from the heavy smeary grain of some matte surfaces. Dirt Rally was also displayed with pleasing contrast overall. This title showcased some much darker environments, which highlighted a few things. The overall atmosphere for such dark areas was good, with decent depth to blacks and dark colours. Brighter elements, such as car headlights, penetrated this darkness very nicely – although appeared slightly grainy due to the screen surface. There was no hindrance peripherally from ‘IPS glow’, either – although there was a bit of ‘VA glow’ towards the bottom corners of the screen. This was much weaker and less widespread than ‘IPS glow’, but it lightened up blacks and dark colours a bit and is normal to an extent on a VA model of this size when viewed from a ‘normal’ distance. Overall, the level of detail was actually superior towards the edges of the screen due to the aforementioned ‘black crush’, which hid some detail centrally. For example, the hills and vegetation in the distance had more distinct structure towards the edges of the screen, whereas centrally this was all quite indistinct. In the very centre, in fact, everything just blended into black. This was again more pronounced than on some other recent VA models we’ve tested, but most users would find this preferable to the atmosphere created by lower contrast models (especially with ‘IPS glow’ added to the mix). We also assessed contrast performance on the Blu-ray of Star Wars: The Force Awakens. There were plenty of dark scenes in this film, with bright elements such as lightsabers and flames piercing through this nicely. The strong contrast performance helped these darker scenes appear nice and deep and also helped the bright elements stand out very nicely. The screen surface again imparted a been of graininess to these lighter shades and there was a bit of detail lost centrally due to ‘black crush’. Overall the monitor helped capture a good atmosphere, which worked nicely for the Star Wars universe and made this film enjoyable to watch. We used Lagom’s contrast tests to analyse contrast performance, helping to highlight issues which may not be apparent during other testing. The following observations were made. The colour gamut of the U3277PWQU (red triangle) was compared with the sRGB colour space (green triangle) and the Adobe RGB colour space (purple triangle) using our ‘Test Settings’. This makes use of the full native gamut of the monitor, which as you can see is rather wide. It doesn’t entirely cover the Adobe RGB colour space (91% coverage) as there is some under-coverage in the green region of this diagram. In the red region of the diagram and interconnecting regions, though, it actually exceeds this. Note that in this representation of the gamut, Adobe RGB actually coincides with sRGB at the green and blue corners. What this means is that ‘normal’ sRGB content, which is currently something of a standard for most consumer media, is displayed with extra saturation. Unlike digitally enhancing saturation (‘Nvidia Digital Vibrance’ or a ‘Saturation’ option in the monitor OSD etc.) you don’t simply drag shades closer to the edge of the gamut, you actually extend the gamut itself as well. So shades maintain their relative separation, appearing varied, but appear more saturated as well. In terms of head-turning vibrancy this is excellent, but for the sake of accuracy not so much. For those who wish to use the Adobe RGB colour space, which will be those who require accurate representation for photography or print-proofing and suchlike, the 91% coverage may be slightly limiting. For those who wish to work accurately within the sRGB colour space, the significant over-coverage is problematic. There is also an ‘sRGB’ emulation mode of this monitor, which is shown in the diagram below. Again, the monitor is represented by the red triangle and the sRGB colour space by the green triangle. You can see here that the colour space is restricted massively using this emulation mode. In fact it only covers 85% of the sRGB colour space, leading the a rather muted look as we commented on earlier. As far as colour accuracy goes this is again limiting and is not something that a colorimeter could compensate for. Really this monitor is designed for general-purpose usage and delivering ‘nice-looking’ colours. Although subjective, the native gamut of the monitor is likely to be more appealing for that than the sRGB emulation mode. Some way between these extremes would have been preferable, though. The Battlefield 1 beta may not be the most colourful of titles, but even that showed excessive sRGB saturation from the monitor. The aesthetic intended to be far grittier and subdued than was displayed by the U3277PWQ. The desert sands showcased a good palette of browns, but they tended towards a redder hue than was intended. The same could be said for many of the character skin tones They were suitably varied, but appeared too saturated with a reddish hue that was not intended and in some cases looked quite unnatural. The saturation was actually lower (more appropriate) towards the sides and bottom edge of the screen due to the shift in gamma associated with viewing angles. The main focus of the screen, the central area, showed pretty much full saturation potential though. And the monitor certainly provided some eye-catchingly vibrant oranges, yellows and reds (fire and explosions) and many of the woody browns of the weapons actually looked quite believable in their depth and tone. Dirt Rally also displayed a pleasing array of shades, although again saturation was stronger than intended. Some greens that should look quite subdued appeared far brighter and more eye-catching than they should. So they didn’t really blend in as they should. There were some very lush and eye-catching deep greens, in the forested regions for example. These appeared somewhat deeper than they should in places but didn’t really look unnatural or out of place overall. The red hue on some brown shades was also evident, making some of the dusty khaki colours look slightly Martian in appearance. The vibrancy of shades shown for the car liveries was quite stunning – and in many cases this actually worked very well. There were some beautifully solid yellows and blues, for example. Bright neon colours also looked appropriately electrifying (cyans, pinks and bright greens in particular. These stood out fantastically when combined with darker background shades, aided by the strong contrast of the monitor. On the flip side oranges verged on red and some deep reds appeared strikingly (and inappropriately) bright. This was not so pronounced towards the flanks and bottom of the screen, due to weakening saturation associated with the panel’s gamma behaviour. Overall these vibrant elements certainly looked vivid and to some users that would be very attractive, but accuracy did suffer due to the untamed colour gamut and the fact that such content is designed with sRGB in mind. On the Blu-ray of Star Wars: The Force Awakens, there was a strong variety of shades reproduced by the monitor and indeed the vibrancy of some of these shades was appealing. The bright blues and reds of lightsabers were particularly striking, more so due to the strong contrast of the monitor and the fact they were often shown in darker surroundings. Some of the more muted greens of vegetation again appeared less muted than they should, neutral brows had an overly red hue that was also shared by some skin tones. This certain wasn’t the look that George Lucas (or Disney) would have intended for this title, but it did make for some quite striking ‘saber sequences’. We also viewed the Blu-ray of Futurama: Into the Wild Green Yonder. With its solid areas of individual shades and an excellent variety of shades displayed, this is a good test for colour reproduction. The weakening saturation near the side edges and in particular bottom of the screen was readily apparent on this title, but even here most shades appeared a fair bit more saturated than they should. The skin tones of characters and various objects within the film are supposed to look quite muted in places, but this monitor didn’t really give them a very ‘pastel’ feel at all. On the other hand, the monitor provided some strikingly vibrant neon shades such as electric blues and pinks alongside some impressively deep blues and purples. The overall look of this film was again appealing in some ways, but not really accurate or how it should look. Lagom’s tests for viewing angles were used to more closely analyse colour consistency and viewing angle performance. The following observations were made from a normal viewing position, eyes around 70cm from the screen. Input lag was assessed for the U3277PWQU using a sensitive camera and a tool called SMTT 2.0. The monitor was compared to various screens of known latency, with over 30 repeat readings taken to help maximise accuracy. Using this method, we calculated 33.65ms (over 2 frames) of input lag. This value reflects not only the signal delay (element you ‘feel’) but also an element of pixel responsiveness (element you ‘see’). This indicates a moderately high signal delay, which some users might find troublesome but others won’t mind. In this article we look at the factors affecting the responsiveness of a monitor. One of the key concepts explored here is ‘perceived blur’, contributed to both by the pixel responsiveness of the monitor but more significantly the movement of our own eyes as we track motion on the screen. We also introduce the idea of ‘pursuit photography’, which is a method used to capture motion on a monitor in a way that more closely reflects what the eye sees. This is done by using a moving rather than stationary camera, so the end result reflects not only the pixel responses of the monitor but also the movement of our eyes (camera) as motion is tracked. The images below show pursuit photographs taken using the UFO Motion Test for ghosting, with the test running at its default speed of 960 pixels per second. This is a practical speed for such photographs and sufficient to allow the key components of perceived blur to be analysed. The monitor was set to various ‘Overdrive’ settings; ‘Off, ‘Weak’, ‘Medium’ and ‘Strong. The middle row of the test (medium cyan background) was used primarily, with one additional photograph taken with a white background. This photograph was taken only with ‘Overdrive’ set to ‘Off’ rather than repeated for every setting. This is simply because this transition was not affected by the ‘Overdrive’ setting and appeared the same regardless. The final image shows a fast 60Hz reference, namely a Samsung S27A750D set to full brightness (avoids PWM) and its optimal response time setting. This shows how things should look on a 60Hz LCD where it is only the movement of the eyes that is contributing to perceived blur, not pixel responsiveness. With ‘Overdrive’ set to ‘Off’, you can see a bold but very short ‘trail’ of sorts both behind and in front of the object. Note that the object runs across the screen from left to right. This indicates some weakness in the transition between the object colour (red) and background colour (cyan) and also some weakness between the background and object. It almost looks as if the object is highlighted with a marker pen, but curiously you don’t get the sort of extended trailing behind the object that you’d usually see on a VA panel for such transitions. This trailing becomes extended during faster motion speeds, but that is very challenging to capture in a pursuit photograph due to the camera movement speed and stability required. What is also interesting is that results with the dark cyan background, which usually show even more pronounced trailing on VA panels, were very similar to the medium cyan backgrounds Hence they weren’t included in this comparison. Pixel transitions were noticeably slower where a very light (white, in this case) background was used as per the second image. Here you can see more extensive trailing behind the red UFO body, although it’s still reasonably faint in this instance. The ‘Overdrive’ setting did not affect the transitions where a white background was used, hence why it was only shown for ‘Off’. The medium cyan background did show some differences, however. Using the ‘Weak’ setting introduced a bit of overshoot (inverse ghosting) which is visible as a dirty trail behind the UFO body and an inverted ‘halo’ trail behind the red body. The bold marker-pen type outline remained to a large extent, however. Using the ‘Medium’ reduced this outline, especially behind the object, but introduced more noticeable and colourful inverse ghosting. The ‘strong’ setting ramped this up considerably, providing very obvious and very eye-catching inverse ghosting. What is interesting in this analysis is the ‘Off’ setting seems optimal, either because the panel is natively as fast as it needs to be or that it already provides a decent level of acceleration (‘Off’ does not always mean that no grey to grey acceleration is used on some level). Even the ‘Weak’ setting introduces some noticeable inverse ghosting in practice and any higher (‘Medium’ etc.) provides very obvious inverse ghosting that is rather unsightly. As far as this test goes, the monitor has really done surprisingly well for a VA panel – but it’s important to consider a broader range of pixel transitions both in terms of shades used and speeds of transition. For this, ‘real-world’ analysis using a range of game titles works nicely. On Battlefield 4 (BF4) there was a fair degree of blur, contributed to predominantly but not entirely by eye movement. In addition to this perceived blur due to eye movement, some weaknesses in pixel responses were evident. The monitor was actually quite unusual in its pixel response performance, for a VA panel. Rather than some transitions being noticeably fast and some noticeably slow, the vast majority of transitions were reasonably fast. There was a bit of weakness that was quite widespread, giving a bit of extra blur in most cases. This became more noticeable at faster transition speeds, for example when turning the character quickly or zipping around in a nimble vehicle such as a Jeep. There was by no means an extreme degree of additional blur, but was just an additional ‘layer of blur’ to contend with. Although ‘high contrast transitions’ were actually somewhat faster than on most VA models, there were some weaknesses here similar to what was shown earlier with the UFO Motion Test analysis. Where there were dark objects (such as a dark-painted vehicle) against a lighter background (such as bright sky) there was a slightly extended trail. This was again not ‘smoke-like’ as it would appear on some VA models, but it did stand out compared to the other transitions which were faster. The dark object also appeared to break up slightly so that very dark red or purple could be seen (this is something we’ve seen on VA panels before, that we refer to as ‘fringe-like trailing’). Likewise, where bright objects (such as white uncapped objective markers) moved against a darker background, there was a bit of extended trailing going on. No inverse ghosting (overshoot) could be observed, which is good. We made similar observations on Dirt Rally. Most perceived blur was linked to eye movement and in-line with what you’d see on even the fastest 60Hz LCDs. There was a widespread ‘mask’ of additional blur on top of this, which was reasonably subtle for the most part and didn’t really affect the gameplay. Sensitivity to this sort of thing varies and it’s fair to say it is significant enough to give sensitive users slightly more of a dizzying sensation during gameplay than they might otherwise get. Having said that, it’s more than likely that any users with serious motion sickness issues would find the experience of any 60Hz LCD to be problematic. There were again some examples of slower ‘extended’ trailing, quite common where dark and shaded trees and vegetation were cast against a backdrop of bright sky. Whilst racing at night this more noticeable extended trailing became more of an issue, too. But as noted on BF4, it wasn’t the sort of extended ‘smeary’ trailing traditionally associated with VA panels. No overshoot was observed, which is good. It’s fair to say that most of the faster transitions on this monitor are a bit slower but some of the slowest transitions similar in speed to some of the best all-round VA performers. The best performers being the likes of the Samsung S34E790C and Samsung C27F591FD, for example. So whilst this model does have some weaknesses in pixel responsiveness, it really isn’t bad as far as VA models goes and is actually one of the better models out there in that respect. We also viewed our Blu-ray movie test titles on this monitor and observed no weaknesses that wouldn’t be apparent on even the best 60Hz performers. The transition speed was perfectly adequate for movie performance on the ~24fps titles that we ran – with the frame rate itself being the main limit to fluidity. In our article on the UHD experience, we look at the benefits and drawbacks of running the ‘4K’ UHD resolution of 3840 x 2160 on a 28” screen. We have also explored the experience of running this resolution on a 31.5” screen in our review of the BenQ BL3201PT/PH. Rather than repeating what we’ve already said near the end of that review, in the ‘The ‘4K’ UHD experience’ section, we would urge you to refer to that passage. The 32” screen size at 3840 x 2160 provides a practically identical experience to this 31.5” 3840 x 2160 screen. To reiterate some key points, we find the pixel density of 139.87 PPI (Pixels Per Inch) to be something of a sweet spot. By this we mean that it’s perfectly comfortable on the desktop, to our eyes, without using scaling. Although this depends on preferred viewing distance and eyesight. We feel that most users should find this usable without scaling with eyes a distance of 60 – 80cm from the screen. Some may find that buttons and UI elements are small but usable, but that text may be a bit tricky to read. So rather than having to scale everything up in the Operating System, which can bring about problems as highlighted in our ‘experience article’, they might prefer to simply use the zoom control on a per-application basis. The images below show the desktop and some of the real-estate afforded by the screen running its full native resolution without scaling. As noted in the BenQ review linked to in the previous paragraph, this excellent pixel density works really nicely for gaming. And indeed the sheer screen size makes for a very immersive experience and allows these details to be appreciated on quite a fine level. Generally, games will not have textures or particle effects which universally take full advantage of the resolution (that would be graphically very taxing), but there are usually some stand-out textures that look really appealing. More so than on models with lower but still decent pixel densities, such as 27” 2560 x 1440 (WQHD), 34” 3440 x 1440 and 40” 3840 x 2160 (‘4K’ UHD) models. The need for anti-aliasing is also greatly reduced, and the clarity as you view distant objects on games is really very impressive. Although it gives very little idea of how the screen actually looks first-hand, we’ve included some shots from various games running in the UHD resolution. You might be looking to run the monitor at a lower resolution, for example 1920 x 1080 (Full HD), either to make a game much less demanding graphically or because you are forced to do so when using a games console. It’s a common misconception that because 1920 x 1080 divides evenly into 3840 x 2160, the monitor should just use 1:4 pixel mapping and display Full HD perfectly. In reality that doesn’t tend to happen and instead an interpolation (scaling) process is used. Exactly the same process that is applied when any other resolution is displayed, regardless of how neatly it should divide into the native 3840 x 2160. For the best results here you should make sure the monitor is handling this scaling rather than the GPU. Users of Nvidia GPUs should open Nvidia Control Panel and navigate to ‘Display – Adjust desktop size and position’. They should then ensure that ‘No Scaling’ is selected and ‘Perform scaling on:’ is set to ‘Display’ as illustrated below. AMD users needn’t adjust anything as things should be set up correctly by default. The interpolation process on the U3277PWQU provides a moderate but not extreme amount of softening. This means that you do lose a degree of sharpness compared to running 1920 x 1080 natively on a 31.5” screen. Things don’t look as soft as they do on some monitors that use interpolation, but you can certainly see a loss of definition, particularly for thin objects or the edges of objects and finer texture details. As the resolution is increased, the softening becomes somewhat less noticeable but is still there compared to running the resolution natively on a screen of similar size. 2560 x 1440, for example, looks quite decent – although again a bit softer than it should. We didn’t find ‘ClearVision’ (sharpness enhancement function using the ‘left arrow’ OSD button) helped and actually made things look quite artificial. As usual, if you keep the monitor at 3840 x 2160 and view 1920 x 1080 (Full HD) content, for example, the GPU or software ‘upscales’ rather than the monitor itself doing anything special. As usual there is a little bit of softening compared to native Full HD but it’s not dramatic. With its 31.5” screen size, the AOC U3277PWQ provides something of a sweet spot for the 3840 x 2160 ‘4K’ UHD resolution. The pixel density is sufficiently high so that things look ‘distinctly 4K’, whilst not so high that things become completely unreadable without scaling. We were quite happy to use this monitor without any scaling, whilst others found using per-application zoom controls rather than having to rely on universal scaling worked nicely for them. The use of a VA panel helped compliment this experience, with strong contrast that helped bring out extra definition and maintain a superior atmosphere in dark scenes compared to competing models with other panel types. The contrast we recorded did fall slightly short of the claimed ‘3000:1’, at ~2500:1 or ~2200:1 following the adjustments made to our ‘Test Settings’. And speaking of these adjustments, they were fairly extensive as the factory default white point was completely out of whack. Gamma tracking was quite good (although not perfect), but perhaps of more important note was the colour gamut of this monitor. Something that will prove quite divisive, we’re sure. It is a wide gamut model that doesn’t offer reliable emulation of the Adobe RGB colour space, as it falls short in some regions and over-extends in others. There is then the sRGB emulation mode, which cuts down this gamut massively. But it’s complete overkill; dropping sRGB coverage to around 85%, which is poor for a modern monitor. There was also a seemingly useless ‘Uniformity’ setting (Uniformity Compensation or UC mode), which actually made little difference to uniformity. Perhaps making it worse rather than better, in some respects. Rather than a non-functional UC mode and a useless sRGB emulation mode, we would much prefer to have seen something functional and useful like a Low Blue Light (LBL) setting. But I digress. Another aspect we weren’t too keen on was the screen surface of the monitor, which was frankly a disappointment given how beautifully smooth and essentially ‘grain-free’ the 32” IPS-type counterparts to this model are. Whilst far from the ‘grainiest’ screen surface we’ve seen, it’s really a shame to see the same screen surface used here as on the 28” TN UHD models. It was at least what we’d classify as ‘relatively light matte’ and only gave a sort of mist of grain rather than obvious smears to the image. But it’s certainly nice to have models of this pixel density not marred at all by any noticeably grain to the screen surface. Whilst a lighter screen surface could have been preferable in terms of vibrancy preservation as well, that really isn’t something this model needed any help with. Colours were very vivid, highly saturated and ‘in your face’ – impressive in some respects, but certainly not accurate. The only let-up in this vibrancy actually came further down or towards the edges of the screen, where a bit of saturation was lost due to the viewing angle weaknesses (perceived gamma shifts) as expected for a VA panel. The extent of these saturation and gamma changes were actually more pronounced than we’ve seen on modern VA panels from other manufacturers (AUO AMVA+ and Samsung curved SVA) – and not just due to the sheer size of the screen. The loss of detail (‘black crush’) in the centre of the screen was also more pronounced than it could have been. We still maintain that the overall atmosphere and contrast performance was strong for such scenes, but things could have been better on a finer level. The final area of image quality to consider is responsiveness, which again left us with mixed feelings. On one hand the input is moderately high and there are some quite widespread weaknesses in pixel responsiveness which give a slight bit of extra blur for many transitions. There are also some (high-contrast) transitions which give more extended trailing. On the other hand, the overall pixel responsiveness was firmly in the ‘decent’ camp and when compared to many VA models was actually rather good. We also liked the overall package delivered here – that is to say the combination of styling (we like brushed metal) and ergonomic flexibility. The stand certainly isn’t the most solidly-built we’ve come across on this sort of monitor, but it certainly does the job. All things considered, this monitor does have its attractions but also has its drawbacks. As with all models, really, it’s about weighing these up against your own personal needs and desires. The bottom line; a screen of two halves with some appealing strengths such as strong contrast and potentially deal-breaking weaknesses such as an untameable wide colour gamut.
Luminance uniformity table 'Test Settings'
Luminance uniformity table UC on
Luminance uniformity 'Test Settings'
Luminance uniformity map UC on
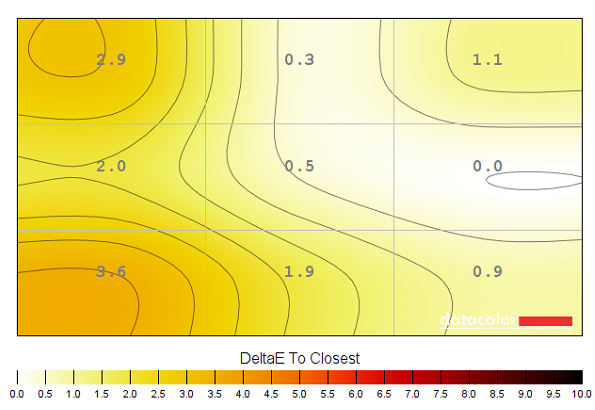
Colour temperature uniformity map 'Test Settings'
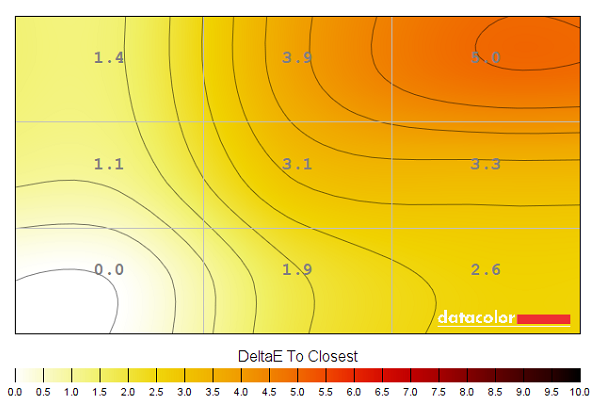
Colour temperature uniformity map UC on
Contrast in games and movies
Lagom contrast tests
Colour reproduction
Colour gamut

Colour gamut
Colour gamut
Colour in games and movies
Viewing angles
The following video shows the results of the Lagom text test, a mixed desktop background and a dark desktop background from a variety of different viewing angles. In the final section of the video you can observe the slight ‘VA glow’ that becomes more prominent off-angle.
Responsiveness
Input lag
Perceived blur (pursuit photography)
Perceived blur with various settings
Responsiveness in games and movies
The ‘4K’ UHD experience
Interpolation and upscaling

Conclusion
Positives Negatives Decent gamma tracking and exceptional vibrancy straight from the box, with a VA panel offering more consistent colours than TN technology plus dithering-free 10-bit colour
A bit of deviation from the ideal ‘2.2’ curve, some over-saturation issues due in part to a wide colour gamut that can’t be tamed and weakening saturation towards the flanks and bottom of screen due to panel type (still weaker than some modern VA panels)
Strong static contrast, delivering a good atmosphere in dark scenes and helping bright elements stand out very nicely in the surrounding darkness Somewhat more ‘black crush’ than seen on other modern VA panels, static contrast below the 3000:1 specified (especially following adjustments) and a bit of graininess to the screen surface Decent pixel responsiveness overall without overshoot, quite good considering the panel type. Good ergonomic flexibility from the stand and a nice stand base and bottom bezel design, in our view
A slight mask of additional ‘blur’ due to slightly slower than optimal pixel responses being quite widespread, some ‘high contrast’ transitions quite sluggish and moderately high input lag
The 31.5” screen and 3840 x 2160 ‘4K’ UHD resolution combined to give good practicality, real-estate and detail levels. Full native capabilities delivered over both DP 1.2 and HDMI 2.0
Not the best interpolation process we’ve seen (but not the worst either). Just a fair degree of softening compared to running resolutions such as Full HD natively
![]()