Author: Adam Simmons
Date published: December 20th 2015
Table of Contents
Introduction
When it comes to solid all-round performance backed by a reliable brand, Dell’s UltraSharp models are often high up on the list. The company’s 27” WQHD (2560 x 1440) models have been some of the most sought after for both home and office users. They have also alternated between offerings with wide and standard colour gamuts. The Dell UP2716D can the thought of as something of a long-awaited follow-up to the U2713H, being the first wide gamut offering in its class from Dell since the U2713H was launched back in 2013. We put this monitor through its paces in our usual gauntlet of tests and see how it performs.
Specifications
The monitor uses a 27” WQHD panel from LG Display. This makes use of AH-IPS technology, with support for 10-bit colour by means of 8-bits per channel + FRC dithering. A 6ms grey to grey response time is specified, which as usual for Dell is probably a more realistic representation of what to expect than the relatively low figures other manufacturers may quote. We have highlighted some key talking points in blue below.
Features and aesthetics
The monitor looks like a lot of Dell’s recent monitors. It is quite angular but sleek and minimalistic. The bezels have the now familiar two-part design with a very thin outer bezel component and a slender panel border that is only clearly visible once the monitor is switched on. The total bezel width, including both components, is around 8mm (0.31 inches) at the top and sides. The bottom bezel is thicker at around 18mm (0.71 inches) including the sliver of panel border here. The bezel here is made from matte black plastic. The screen surface is a very light matte anti-glare solution that some users may refer to as ‘semi-glossy’. This is explored a little later on.
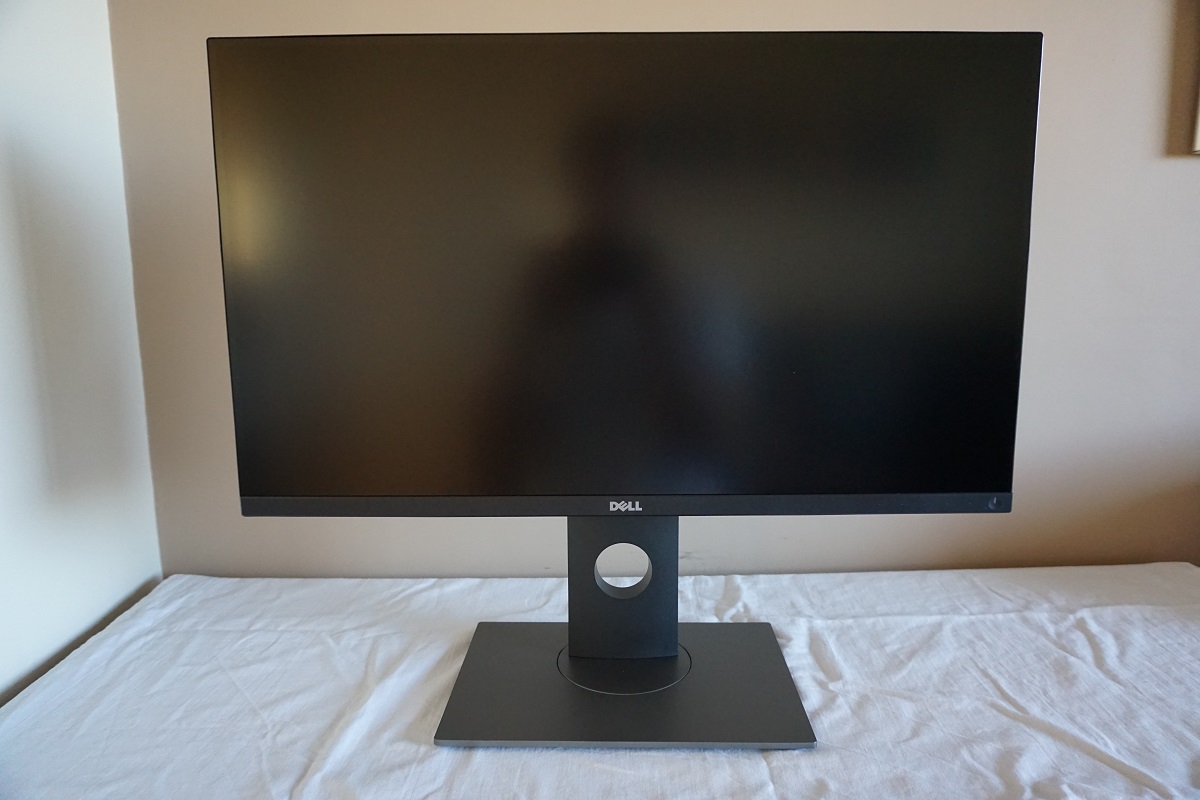
The OSD (On Screen Display) is controlled by illuminated touch sensitive buttons to the right of the bottom bezel. These proved quite responsive and were easy enough to use. The power button is tactile, at the bottom right of the monitor, and has a vertical slit integrated into it to indicate the power state of the monitor. During normal operation it glows white, and during a low power state (standby or ‘Active-off mode’ as VESA refers to it) it will slowly blink white. If you press the button to turn the monitor ‘off’, it will not be illuminated. The following video gives a run-through of the OSD.
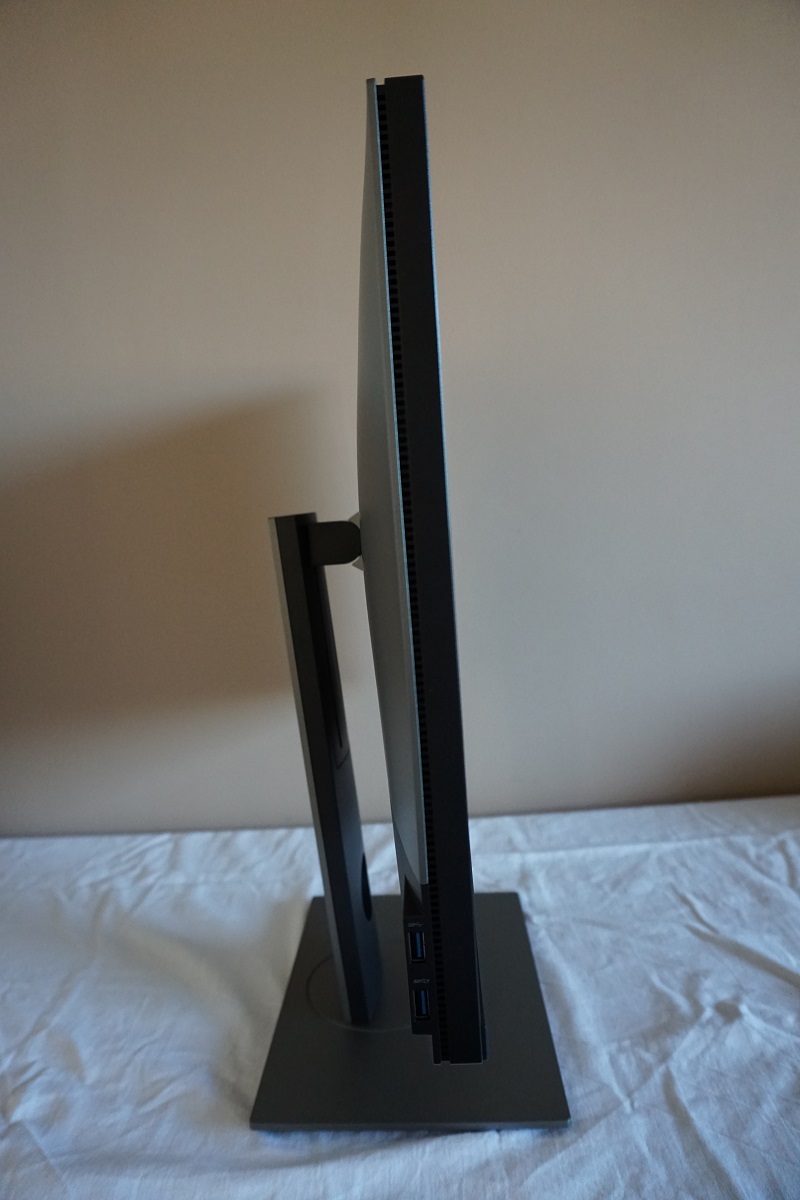
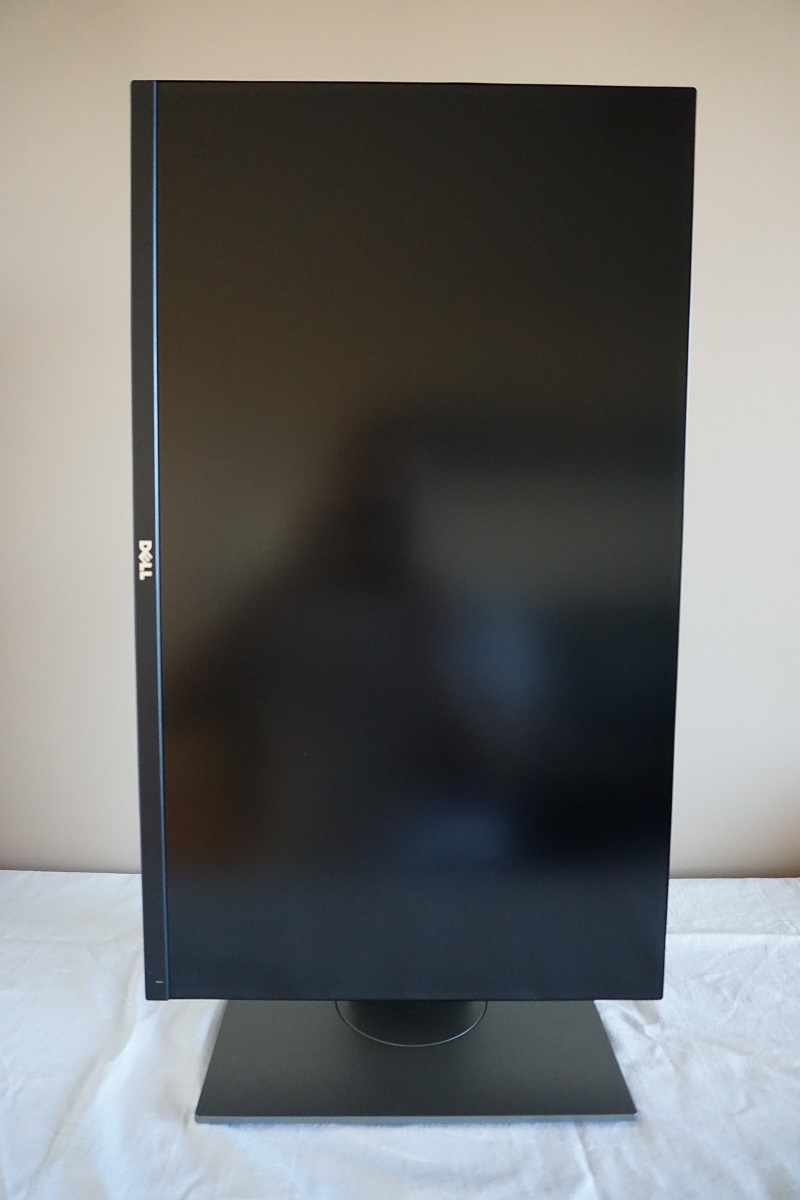
From the side the monitor is pretty slim at around 20mm (0.79 inches) at thinnest point but lumping centrally where the stand attaches. The total depth of the screen including stand and base is 200.30mm (7.89”). From the side you can also see the two-tone colour scheme used, with an elegant mix of matte black and silver plastics. There are also 2 USB 3.0 ports on the left side of the monitor, the bottom of which has a little lightning icon and supports rapid charging of connected devices (BC 1.2). The included stand offers excellent adjustability; tilt (5° forwards, 21° backwards), height adjustment (130mm or 5.12 inches), swivel (45° left and 45° right) and pivot (90° clockwise rotation into portrait). At lowest height the monitor clears the desk by around 53mm (2.09 inches) with the top of the screen around 415mm (16.34 inches) above the desk surface.
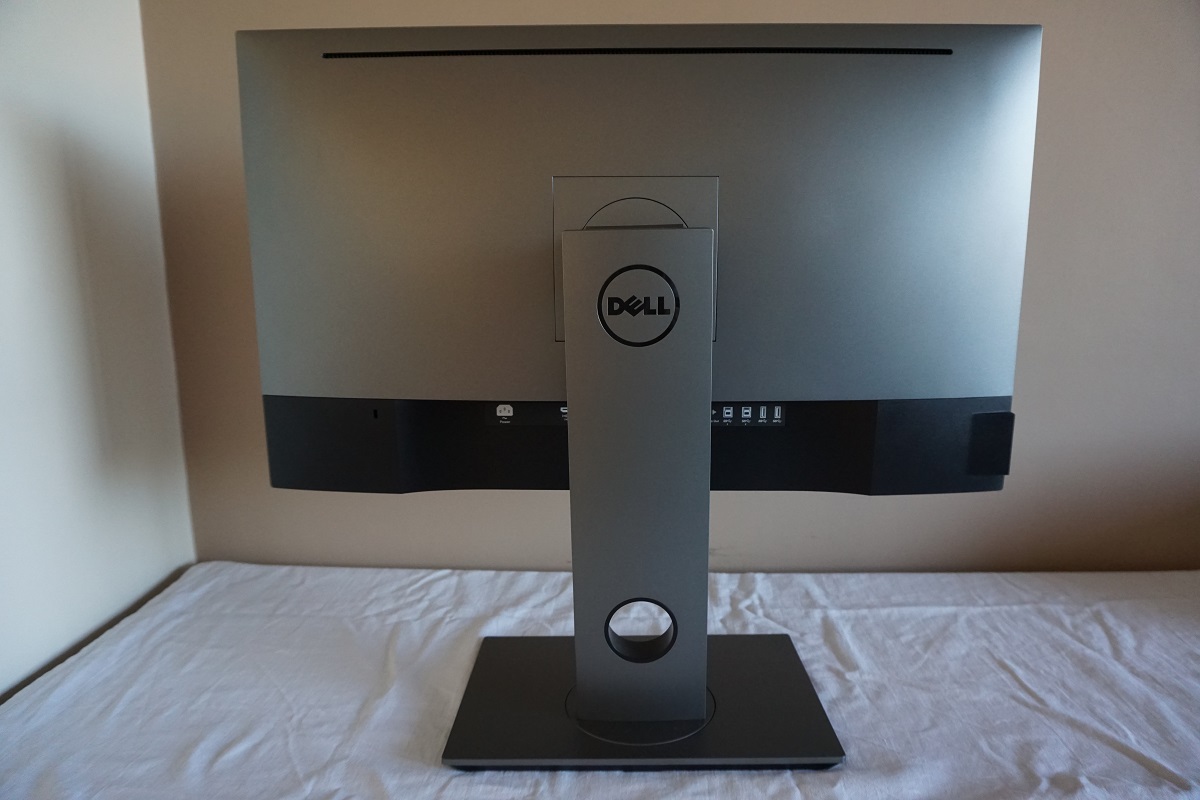
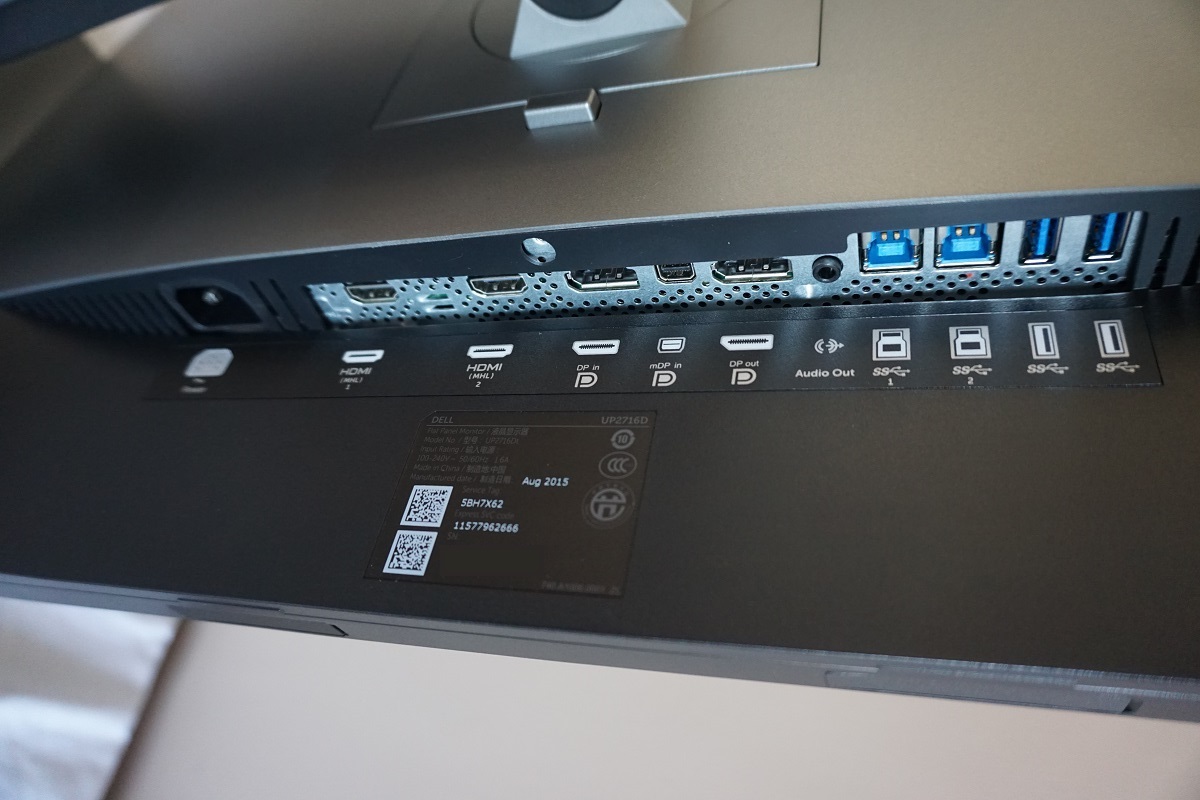
The rear of the monitor is dominated by silver matte plastic, with a bit of black matte plastic towards the bottom. The stand attaches using a proprietary bracket mechanism to the centre of the screen and can be released using the ‘quick release’ button just under the attachment point. 100 x 100mm VESA holes are included for attachment of the screen to an alternative stand or mount. There is a Kensington lock slot to the left of the port area. The ports themselves are down-firing; AC input (internal power converter), 2 HDMI 1.4 ports (with MHL 2.0), DP 1.2 input, MiniDP 1.2 input, DP output (for MST daisy chaining), 3.5mm audio output, 2 USB 3.0 upstream ports and 2 further USB 3.0 downstream ports (4 total).
When you first get the monitor you should notice that the DP output has an orange rubber plug over it. This is so that you don’t mistake it for a DP input and become confused when the monitor doesn’t display an image. The plug is easily removed if you want to use the DP output. Standard cables include a power cable, MiniDP – DP cable and USB 3.0 upstream cable.
Calibration
Subpixel layout and screen surface
The monitor uses a very light matte screen surface (some may call it ‘semi-glossy’), with a relatively low haze value. This allows the monitor to provide a good balance between clarity, vibrancy and anti-glare characteristics. The surface texture is smooth, so that the image looks considerably less grainy than on some matte screen surfaces. Light emitted from the monitor is not diffused to the extent that it is on some monitors, either, so vibrancy and clarity is better preserved. Meanwhile the surface has good glare-handling, allowing it to be comfortably used in a decent range of lighting conditions.
![]()
The subpixel layout is the usual RGB (Red, Green and Blue) stripe, which is the most common and the default expected by modern Operating Systems including Windows and MacOS. Mac users needn’t worry about ‘text fringing’ issues whilst Windows users don’t need to run ClearType. They may still wish to do so just to fine-tune according to their preferences, though.
Testing the presets
The UP2716D offers a range of ‘Preset Modes’; ‘Standard’, ‘Multimedia’, ‘Movie’, ‘Game’, ‘Paper’, ‘Color Temp.’, ‘Color Space’ and ‘Custom Color’. Different presets allow you to access different options. In ‘Custom Color’ you have access to a range of unique settings and in ‘Color Temp.’ you can set a predefined colour temperature, as explored in the OSD video previously. Also worth noting is that in ‘Standard’, ‘Color Temp.’ and ‘Custom Color’ the ‘Uniformity Compensation’ feature is set to ‘Calibrated’ (enabled) by default and can be disabled. In other presets or the aforementioned presets with changes to contrast or changes to any of the ‘Custom Color’ specific settings (hue, saturation etc.) this feature isn’t available.
Rather than look at every conceivable set of settings, which would be extremely tedious, we’ve selected a few which we found particularly interesting or feel will appeal most to users of this monitor. The table below highlights the general image characteristics under a range of settings, in addition to central gamma and white point readings provided by a Spyder5ELITE colorimeter. Note that ‘Color Temp.’ and ‘Custom Color’ without adjustments are essentially the same as ‘Standard’ and hence haven’t been documented separately. Our test system uses Windows 10 with the monitor connected to an Nvidia GTX 970 via DP 1.2. The monitor was left in its ‘plug and play’ state without additional drivers or ICC profiles loaded. Unless otherwise stated assume default settings were used, the exception to that being for our ‘Test Settings’ where various changes were made as explored later.
| Monitor Settings | Gamma (central average) | White point (kelvins) | Notes |
| Standard (Uniformity Compensation = Off) | 2.2 | 6727K | Fairly bright and extremely vibrant-looking. sRGB content looks obviously oversaturated with reds, oranges and greens looking particularly extreme in this respect. The range of shades and consistency is excellent, though, in contrast to upping ‘Digital Vibrance’ or the saturation levels where shades are crushed together. |
| Standard (Uniformity Compensation = Calibrated) | 2.2 | 6683K | Quite similar to the above in terms of overall image characteristics, but marginally dimmer with a mild green tint. This tint is only really noticeable once activating the mode and comparing it to its deactivated state, the eye readily compensates for it as it’s very slight. |
| Paper | 2.2 | 5525K | This mode retains some of the native saturation of ‘Standard’ but is dimmer and has a warm-green tint. This is a ‘Low Blue Light’ setting designed for more relaxing evening viewing. For this, we personally prefer using ‘Color Temp. = 5000K’ for marginally higher blue light reduction without the green tint. |
| Color Space = Adobe RGB | 2.2 | 6508K | As with ‘Standard’ there is pleasing shade variety and consistency. sRGB content remains oversaturated in places, but the more extreme saturation of red and orange shades in particular is cut back. It’s still there to some extent, but the intensity is reduced. This is an emulation mode designed for work using the Adobe RGB colour space, specifically. |
| Color Space = sRGB | 2.2 | 6614K | This is an sRGB emulation mode and as such it cuts down completely on the sRGB oversaturation of other modes. The image actually looks quite faded, even compared to pretty much any ‘Standard gamut’ IPS-type model we’ve used recently. This mode is designed specifically for work within the sRGB colour space, but we would wager most users might prefer different settings for general usage. |
| Color Space = REC709 | 2.4 | 6365K | This mode emulates the Rec. 709 colour space, or more specifically has a gamut similar to sRGB (as explored later) but targets a different gamma. The image is dimmer at its default brightness but can still be cranked up reasonably high. Colours look richer than with the sRGB emulation mode, without the oversaturation of other modes. There is a fair degree of crushing at the low end, though, perhaps in part due to the gamma behaviour. Some shades also look a bit more muted than we’re used to on other ‘Standard gamut’ models. |
| Color Space = DCI-P3 | 2.6 | 6555K | This mode emulates the DCI-P3 colour space and associated parameters. The image appears rich and dim (default brightness is only 15%) with extreme crushing at the low end and considerable oversaturation of sRGB content in places. Needless to say this mode is specifically designed for DCI-P3 content creation or viewing. This standard is used in many digital movie theatres (DCI = Digital Cinema Initiatives). |
| Test Settings (as below) | 2.2 | 6476K | The brightness is now much more comfortable and overall colour balance and white point improved by manual colour channel correction. There remains oversaturation of non-colour-managed sRGB content. This is very different to oversaturation you can achieve by using a ‘saturation’ slider (Nvidia Digital Vibrance or a similar setting on the monitor OSD) as we explore later. |
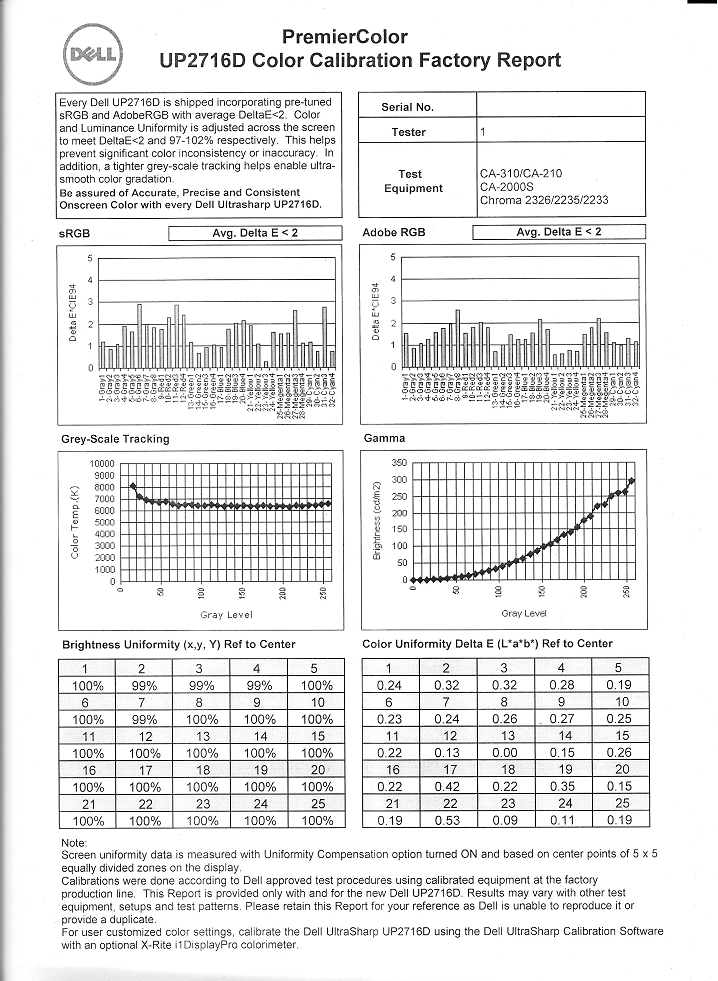
Out of the box the monitor is fairly bright, but not overwhelmingly so. Due to the extremely generous native colour gamut in this ‘Standard’ setting, the potential range of colours is massive but ‘normal’ sRGB content appears significantly oversaturated. There are a number of ‘Color Space’ presets including; ‘sRGB’, ‘Adobe RGB’, ‘Rec709’ and ‘DCI-P3’. This provides good flexibility for those who work within those colour spaces and image configurations and require accurate output for their work. The ‘sRGB’ and ‘Adobe RGB’ presets are specifically mentioned on a factory calibration report. This is unique to each individual unit and verifies that the monitor was calibrated to meet various criteria such as gamma, white point and DeltaE colour accuracy in those modes. The report for our unit is shown below. Note that you can address the LUT of the monitor and perform your own calibration using the Dell UltraSharp Calibration Software and an X-Rite i1DisplayPro colorimeter. There are two separate user-calibrated preset slots for this under ‘Color Space’; ‘CAL1’ and ‘CAL2’.
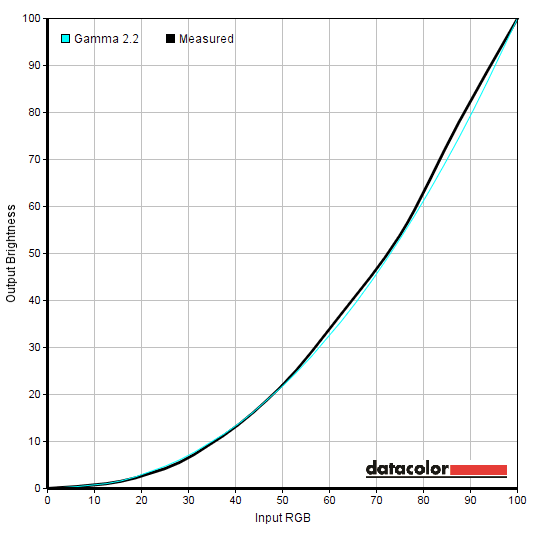
There is also a ‘Uniformity Compensation’ (UC) setting available in specific presets as mentioned earlier. The ‘Standard’ mode, for example, has this feature enabled by default. If you disable it, as mentioned previously, the absolute precision of the calibration is reduced. You gain contrast as we explore a bit later, but the gamma curve deviates a bit from the 2.2 curve. You can see this below, using ‘Standard’ as an example. The top image shows this with UC set to ‘Calibrated’ (i.e. the factory default settings) whilst the bottom image shows this preset with UC set to ‘Off’. Note that the average gamma remains at 2.2, but there is some departure from the curve.
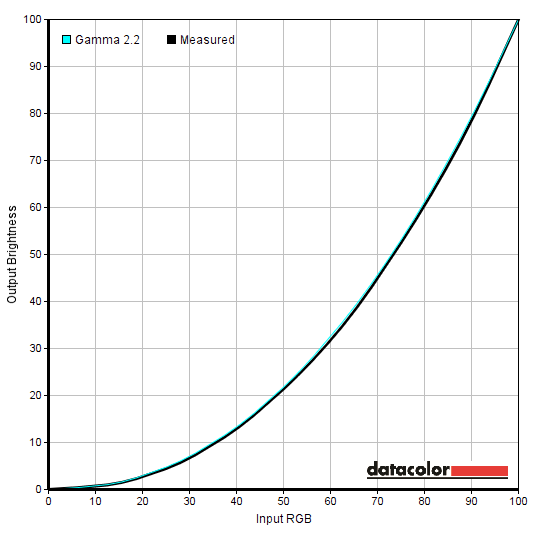
Gamma UC Calibrated
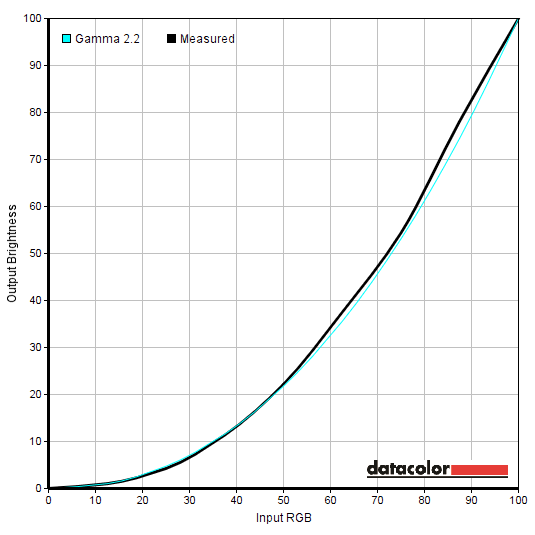
Gamma UC Off
The ‘Color Space’ preset options do not have a UC setting specifically associated with them and track very close indeed to the standard ‘2.2’ curve. For our ‘Test Settings’ we made significant adjustments to the ‘Saturation’ levels, amongst other things, in the ‘Custom Color’ preset. This forcefully deactivates UC and means that the gamma tracking isn’t perfect. However; the deviations aren’t worrying at all for general usage and for users who require absolute precision here either use of one of the ‘Color Space’ presets or a full calibration using a colorimeter or similar device would be advised.
Gamma Test Settings
A couple of presets that are essentially ‘Low Blue Light’ settings are also included. There is ‘Paper’, which has quite a green tint to it due to only the blue channel being lowered but the green channel remaining strong (alongside the red channel). The alternative is to use ‘Color Temp.’ and set the monitor to ‘5000K’. This gives the image a warm look without the green tint and provides the same if not slightly enhanced blue light reduction. This is something we like to use for our own viewing comfort later on in the evening. Not when we are testing the monitor, specifically, but when blue light output from the monitor should be reduced as much as possible. That’s because it is a signal the body uses to stay alert (daylight is naturally rich in blue light) and is not something you should seek to expose yourself to too much before bed.
Test Settings
Our ‘Test Settings’ involved extensive adjustments to the ‘Custom Color’ preset, as shown below. This was designed to provide an image that is richer and more pleasing for general use than the ‘sRGB’ mode, but without the same level of oversaturation shown in most of the other presets. It wasn’t possible to counteract all of the oversaturation, as things simply start to look flooded or shades simply look completely wrong with further reductions. If you lower red further, for example, orange shades start to lose the required intensity and look overly yellow. Some red shades start to look completely wrong as well. Lowering magenta further can take the edge off some of the brighter magenta shades, but lighter pinks (the colour of a person’s tongue, for example) become far too muted. Note that any settings not mentioned here were left at default. We’ve also included the ‘Response Time’ setting used in the review, just for reference.
Brightness= 58 (according to preferences and lighting) R Gain= 100 G Gain= 98 B Gain= 95 R Saturation= 40 G Saturation= 35 B Saturation= 50 C Saturation= 35 M Saturation= 35 Y Saturation= 50 Response Time= Normal
Preset Mode= Custom Color
Contrast and brightness
Contrast ratios
A KM CS-200 was used to measure the luminance of white and black using a range of monitor settings, including those discussed in the calibration section. From these values, static contrast ratios were calculated. These are shown in the table below. Values for the highest white luminance, lowest black luminance and peak contrast ratio recorded highlighted in blue. Results under our ‘Test Settings’ are highlighted in black. With the exception of our ‘Test Settings’, where various adjustments were made, assume any setting not mentioned was left at default.
| Monitor Settings | White luminance (cd/m²) | Black luminance (cd/m²) | Contrast ratio (x:1) |
| 100% brightness (UC = Off) | 289 | 0.23 | 1257 |
| 100% brightness | 189 | 0.23 | 822 |
| 80% brightness | 189 | 0.23 | 822 |
| 60% brightness | 156 | 0.19 | 821 |
| 40% brightness | 111 | 0.14 | 793 |
| 20% brightness | 66 | 0.08 | 825 |
| 0% brightness | 21 | 0.03 | 700 |
| Standard (UC = Calibrated, Factory Defaults) | 189 | 0.23 | 822 |
| Paper | 107 | 0.09 | 1189 |
| Color Space= Adobe RGB | 194 | 0.17 | 1141 |
| Color Space= sRGB | 200 | 0.19 | 1053 |
| Color Space= REC709 | 101 | 0.08 | 1263 |
| Color Space= DCI-P3 | 51 | 0.04 | 1275 |
| Test Settings | 158 | 0.15 | 1053 |
The UP2716D yielded an average static contrast of 792:1 with only brightness adjusted. This was reduced due to the fact that ‘Uniformity Compensation’ (UC) was set to ‘Calibrated’ (enabled). With this disabled, as per all of the other settings we tested, the contrast was higher. In ‘Standard’ with UC disabled the contrast rose to a strong 1257:1 with the maximum value recorded using ‘Color Space = REC709’ (1263:1). These are strong values for an IPS panel. The adjustments we made for our ‘Test Settings’ (specifically to the colour channel ‘Gain’ control) reduced the contrast to a still respectable 1053:1. The maximum white luminance recorded on this table was 289 cd/m² with the minimum a very low 21 cd/m². This provided a luminance adjustment range of 268 cd/m² with plenty of useable values. Interestingly the brightness was ‘capped’ at 189 cd/m² with UC enabled and reached this even at the default brightness of ‘75’. Increasing the brightness to ‘100’ had no effect whatsoever on either the black or white luminance. Without UC enabled the monitor responded as you’d expect as you increase brightness beyond ‘75’ – although this is not documented on the table, it was tested.
The monitor has a ‘Dynamic Contrast’ feature which can be activated in the ‘Game’ or ‘Movie’ presets. This locks off manual control of the brightness and allows the backlight to automatically adjust according to the level of ‘Light’ and ‘Dark’ on the screen. As with all current LCD monitors, the backlight is controlled as a single unit (BLU) – it therefore can’t reduce the brightness for some sections of the screen whilst increasing it for others. This implementation reacted at a moderate pace to changes in the makeup of the image, but tended towards being rather bright during mixed images with plenty of dark areas. As usual we preferred to have this feature disabled and maintain control over the backlight brightness ourselves, adjusting according to preferences and lighting as is the preferred way of doing things.
PWM (Pulse Width Modulation)
The UP2716D does not use PWM (Pulse Width Modulation) at any brightness level. Instead, DC (Direct Current) dimming is used throughout its adjustment range. The backlight is therefore considered ‘flicker-free’, which will come as welcome news to those sensitive to flickering or other side-effects of PWM usage such as PWM artifacts.
Luminance uniformity
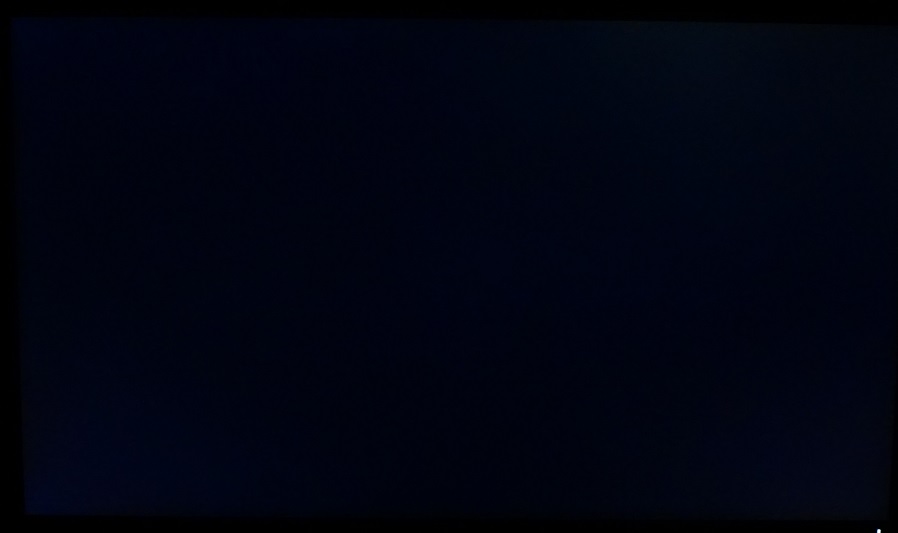
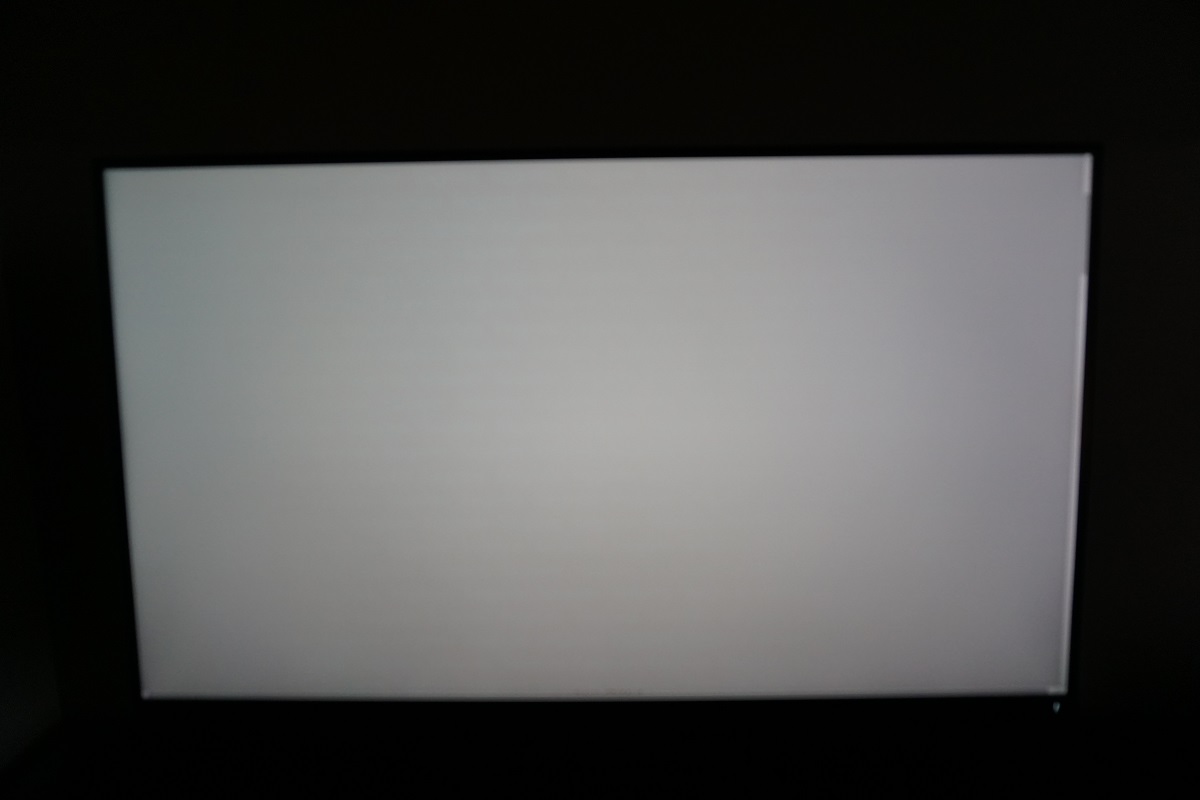
Whilst observing a black screen in a dark room, using our test settings, we could see some backlight bleed, particularly towards the bottom left and top right corners of the screen. You can hopefully see on the image below that this was fairly minor in the grand scheme of things. Note that the photograph was taken a few metres back from the monitor to eliminate ‘IPS glow’ and that individual units can vary when it comes to backlight bleed. ‘IPS glow’ is something that is characteristic of the panel type and does not vary between units of the same model. From a normal viewing position, you can see a slightly red or silvery-blue tint towards the bottom corners of the screen in particular. The colour depends on the viewing angle, with the ‘red’ tint seeming a bit more intense than usual on this model due to the backlight used. This blooms out more noticeably if you move ‘off angle’, as shown in the viewing angles video later on in the review.
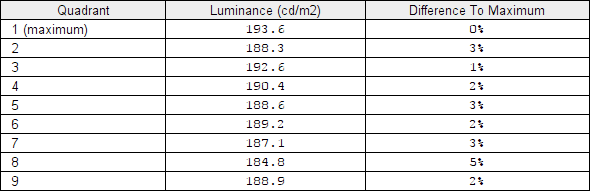
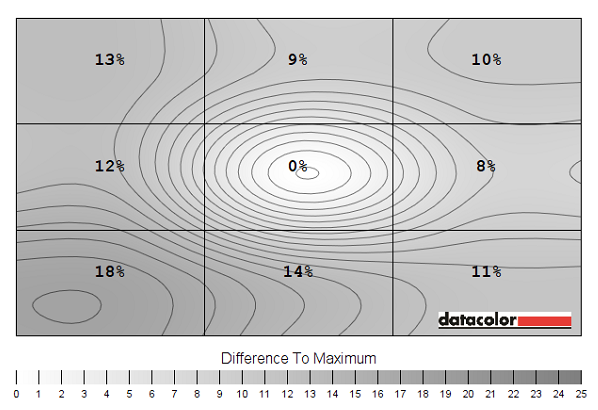
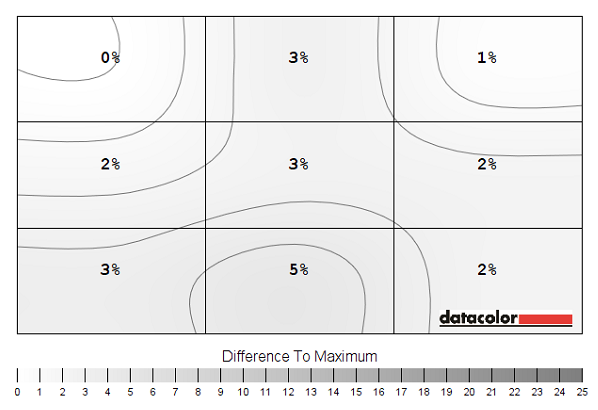
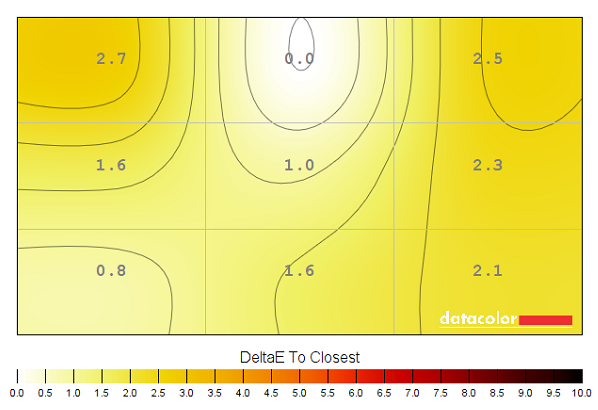
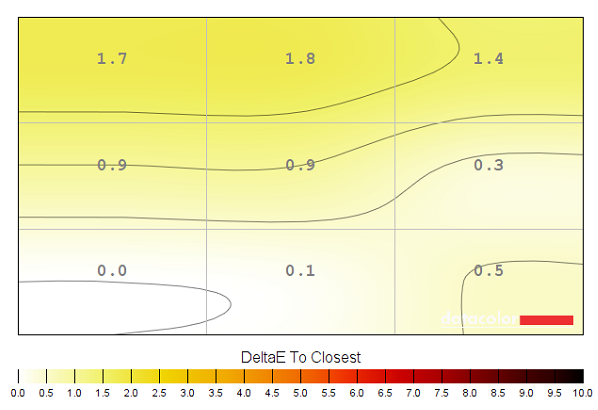
We also assessed the uniformity of lighter colours using the Spyder5ELITE to analyse 9 equally spaced quadrants running from the top left to the bottom right of the screen. The tables below shows the percentage deviation between a given quadrant and the brightest quadrant measured. The top table shows the results using our ‘Test Settings’, whereas the bottom table shows the factory defaults (including ‘Uniformity Compensation’ being set to ‘Calibrated’). We’ve introduced the ‘Uniformity Compensation’ (UC) previously. What this does is to digitally alter brightness levels at various points of the screen to make the brightness more uniform. As we’ve explored already, this comes with a bit of a hit in contrast and maximum brightness potential. You also can’t have it enabled in certain presets or when certain adjustments are made. It’s designed to be used at the default brightness setting of ‘75’, specifically. Having said that, you should still expect it to work fairly well at lower brightness settings as well, at least when it comes to luminance uniformity. Although not documented in the table, the ‘Color Space’ settings such as ‘Adobe RGB’ offered uniformity more comparable to our ‘Test Settings’ than with UC enabled. Under our ‘Test Settings’ the luminance uniformity of the screen was fair. The brightest point recorded was ‘quadrant 5’ in the centre of the screen (156.8 cd/m²). The greatest deviation occurred at ‘quadrant 7’ towards the bottom left of the screen (128.9 cd/m² which is 18% dimmer than the centre). Elsewhere deviation from the centre was 8- 14%. The luminance uniformity with UC activated was excellent. The brightest point recorded was ‘quadrant 1’ towards the top left of the screen (193.6 cd/m²). The greatest deviation from this occurred at ‘quadrant 8’ below the centre of the screen (184.8 cd/m² which is just 5% dimmer). Note that individual units will vary when it comes to uniformity and there can be variation beyond the measured points. The UC setting does seem to be effective, though, and Dell calibrates each individual unit in this fashion using 25 quadrants for high levels of consistency right across the screen. Below there are contour maps to represent the deviations graphically. The top map shows the results under our ‘Test Settings’ and the bottom with the UC mode enabled (factory defaults). Here darker greys represent lower luminance than lighter greys. The percentage deviation between each quadrant and the brightest recorded quadrant is also given. The Spyder5ELITE was also used to analyse deviations in colour temperature (white point), using the same white quadrants analysed above. The following contour maps show deviations between each quadrant and that closest to 6500K (the D65 daylight white point target). Deviations here are assigned DeltaE values, with higher values representing greater deviations. A Delta E <3 is considered deviation that most users would not readily notice by eye. Darker colours on these graphics represent higher deviation from 6500K than lighter colours. The top graphic is again for our ‘Test Settings’ and the bottom with UC enabled.
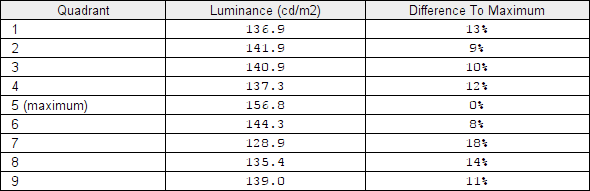
Luminance uniformity table 'Test Settings'
Luminance uniformity table 'UC = Calibrated'
Luminance uniformity map 'Test Settings'
Luminance temperature uniformity map 'UC = Calibrated'
Colour temperature uniformity map 'Test Settings'
Colour temperature uniformity map 'UC = Calibrated'
Under our test settings results are already strong, with no significant deviations between each quadrant and the point closest to 6500K. The highest deviation was recorded towards the top left, with a DeltaE of 2.7. The UC feature does yield improvements, dropping the maximum deviation down to a DeltaE of 1.7 (again at the top left). Again, individual units can vary in this regard and you can expect deviation beyond the points measured. Regardless of this, it seems the UC feature (which is specifically calibrated for each unit) does exactly what it set out to do. Note as well that deviations in ‘colour temperature’ on wide gamut models like this can manifest with various ‘green’ or ‘pink’ hues as demonstrated in the Lagom text test later on.
Contrast in games and movies
On Star Wars Battlefront the contrast performance was good overall. The shadowy regions of the ‘Endor’ forest regions and dark interiors highlighted this nicely. Here bright elements such as gunfire, sparks and explosions stood out nicely against darker backgrounds. The level of detail was also pleasing in these dark areas towards the centre of the screen, but detail was lost peripherally due to the aforementioned ‘IPS glow’. Bright elements had a rather smooth (non-grainy) look to them thanks to the smooth and light matte screen surface.
On Dirt Rally the contrast performance was also respectable overall. This was particularly noticeable whilst driving at night, where bright shades such as car headlights stood out nicely in the surrounding darkness. Under such conditions ‘IPS glow’ was also particularly noticeable peripherally, particularly towards the bottom two corners of the screen. This ate away at detail in dark areas and made them appear somewhat flooded in the regions that it affected. Elsewhere detail levels in dark areas was good, for wrinkles of leather inside the car and tire tread patterns on the outside. Bright shades appeared quite smooth without obvious graininess, too.
The contrast was decent overall in the Blu-ray of Skyfall. The thick black borders at the top and bottom from the ‘16:9 letterbox’ format of the screen absorbed much of the IPS glow. Bright elements stood out nicely in dark surroundings, whilst the level of detail in dark scenes was much as it should be really.
Lagom contrast tests
Lagom’s tests for contrast were used to help analyse specific weaknesses in contrast performance which may not be readily apparent during other testing. We observed the following.
Colour reproduction
Colour gamut
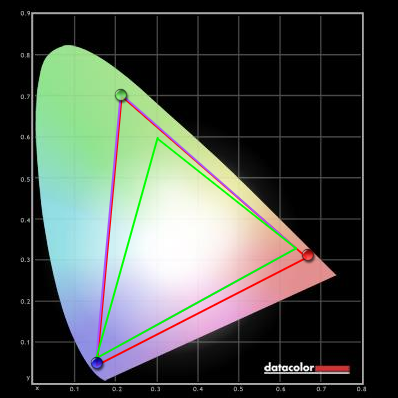
The UP2716D’s colour gamut (red triangle) was compared to the sRGB (green triangle) and Adobe RGB (purple triangle, where applicable) colour spaces using a range of settings. The Spyder5ELITE was used to analyse this. The monitor includes various colour space emulation modes and was also modified quite heavily for our ‘Test Settings’. The images show the colour gamut in the following settings, respectively; ‘Standard’, ‘Adobe RGB’, ‘sRGB’, ‘REC709’ and ‘DCI-P3’.

Colour gamut 'Standard'

Colour gamut 'Adobe RGB'

Colour gamut 'sRGB'

Colour gamut 'REC709'

Colour gamut 'DCI-P3'
The native colour gamut of the monitor (‘Standard’ – top image) comprehensively covers both the sRGB and Adobe RGB colour spaces. There is extension beyond the Adobe RGB colour space, even, particularly in the red region of this representation. Note that the Adobe RGB colour space actually coincides with sRGB in this ‘corner’ of this representation. The ‘Adobe RGB’ emulation mode cuts this down effectively so that it fully covers the Adobe RGB colour space without much over-extension at all. The ‘sRGB’ emulation mode does this same with the sRGB colour space, with just a smidge of under-coverage but nothing to write home about. The ‘REC709’ emulation mode is largely the same with a bit of extension beyond in places, whilst ‘DCI-P3’ does an excellent job of emulating the ‘DCI-P3’ colour space (not shown in this diagram – but essentially coinciding with the monitor’s gamut here). The image below shows the gamut under our ‘Test Settings’, which is broader overall than ‘Adobe RGB’ but cut down a bit compared to the native gamut. Indeed, the representation of colours is quite different regardless of the gamut, with the saturation of reds and greens in particular being less intense than either of the other modes.
Colour gamut 'Test Settings'
Colour in games and movies
On Star Wars Battlefront the monitor presented colours in a vibrant but varied way. Unlike on a normal monitor with saturation bumped up, an excellent range of distinct shades was maintained. On a normal monitor, if you increase saturation by using Digital Vibrance, saturation controls or certain presets with increased saturation etc. you compress the shade range. Shades are simply pulled towards the edge of the gamut whilst the gamut itself remains the same. Here shades are again pulled closer to the edge of the gamut, but there is also a corresponding extension to the gamut itself (i.e. this is a wide gamut monitor). There were some beautifully lush dark greens on the forests of Endor, with a good range of more muted shades. But there were certainly some shades that appeared more saturated than they should, for example some of the lighter greens for vegetation stood out a bit better than was intended and appeared too intense. Another example of this is fires, as they appeared a rich mixture of red and orange, but some of these oranges appeared a bit too close to ‘red’ whilst yellow elements had a bit of an orange tint. This was less extensive than the oversaturation caused by the monitors native gamut, though, and was worlds away from increasing vibrancy on a normal monitor where fires might just encompass a few shades of almost cartoon-like red or yellow and little else. Overall shades appeared rich with strong but not extreme levels of saturation on this title.
On Dirt Rally there was again a dazzling range of shades with strong vibrancy. Again, this was not as extreme as with the native gamut or indeed some of the other presets on this monitor (including ‘Adobe RGB’). The most noticeable oversaturation again applied to some of the green shades, which meant some areas of vegetation stood out by looking brighter and quite a bit less muted than it should. Minty greens looked overly deep, too. Intertwined with this were some incredibly lush deep greens and rather fetching golden-green shades as well. The dusty Khaki colours on some of the tracks still looked appropriately muted overall, with good neutral greys and browns. There wasn’t the sort of red push you see if using the native gamut of the monitor, for example, which could upset balance here. It must be noted that the strongly saturated shades worked very nicely when it came to car liveries and colourful advertising around the track. There were some incredibly vivid cyans, bright yellows, electric blues and neon greens (amongst others) that stood out with impressive intensity.
The Blu-ray of Skyfall appeared largely as it should, with a bit of oversaturation in places. This oversaturation was far less extreme than you’d see from an untamed wide gamut monitor, however. Some skin tones appeared to have a slight additional ‘rosiness’ to them, but this was not enough to give them a sunburnt look or make them otherwise look inhuman. The distinction between individual character skin tones also remained strong. There were good neutral greys and browns and some good deep greens, helping natural environments and buildings within them appear quite natural. There were some lighter greens that stood out a bit more than they should, however. Fire appeared natural if a bit too rich, but it maintained a good variety of shades within (yellows, oranges and reds primarily). The red dress worn by Miss Moneypenny in some of the scenes and the cyan neon lights in some of the Shanghai night scenes were quite electrifying in their vibrancy.
We also tested the Blu-ray of Futurama: Into the Wild Green Yonder. This showcased some dazzling colours, with some rather arresting vibrancy in places. This was the case right from the get go, with truly dazzling neon green cosmic radiation and some extremely violet-looking planets unlike anything most monitors could display. Deep royal blues, deep yellows and bright oranges were also good, although some darker oranges were too heavily tinted with red. The pastel shades, such as those used on the skins of characters, showed pleasing variety and subtle variation. The consistency of a given shade at various points of the screen was very good, in other words. The saturation levels of such pastel shades was too deep, though. The skin of characters of some of the main characters had a certain red hue to them rather than looking a pale peach. And the red lobster-like space monster called Dr. Zoidberg appeared a more striking red than he should. So again, the representation of what is intended to be sRGB content on a monitor with a much broader colour gamut than that is something of a mixed blessing. It provides an aesthetic that some users will actually like, but that detracts from the intended aesthetic of the content.
Viewing angles
We used Lagom’s tests for viewing angle to further explore colour consistency and the viewing angle performance of the monitor. The following observations were made from a normal viewing position, around 70cm from the screen.
The video below shows the results of the Lagom text test as well as a mixed and dark desktop background from a range of viewing angles. For the lighter content you can see that the monitor maintains a good level of contrast and displays shades well from a range of viewing angles. In the final section of the video, with the dark desktop background, you can see the aforementioned ‘AHVA glow’.
Responsiveness
Input lag
A sensitive camera and small utility called SMTT 2.0 was used to calculate input lag on the UP2716D by comparing to a range of monitors of known latency. Over 30 repeat readings were taken to enhance accuracy. Using this method, we calculated 5.13ms (just over 1/3 of a frame) of input lag. This value is influenced by both the pixel responsiveness (element you see) and signal delay (element you feel). It indicates a very low signal delay which shouldn’t prove problematic to even sensitive users. Note that the ‘Game’ mode has no bearing on this value or indeed response times and is simply a preset with modified image quality characteristics.
Perceived blur (pursuit photography)
In our responsiveness article we explore the concept of perceived blur and how this is influenced not just by the pixel responses of the monitor but, more importantly, the movement of our own eyes. We also introduce a technique called ‘pursuit photography’ which can capture motion on a monitor in a way that reflects not only what the monitor is doing but also the blur caused by eye movement. This technique uses a moving camera to simulate eye movement but also highlights trailing from slower than optimal pixel response times and overshoot (inverse ghosting) from excessive levels of pixel overdrive (grey to grey acceleration.
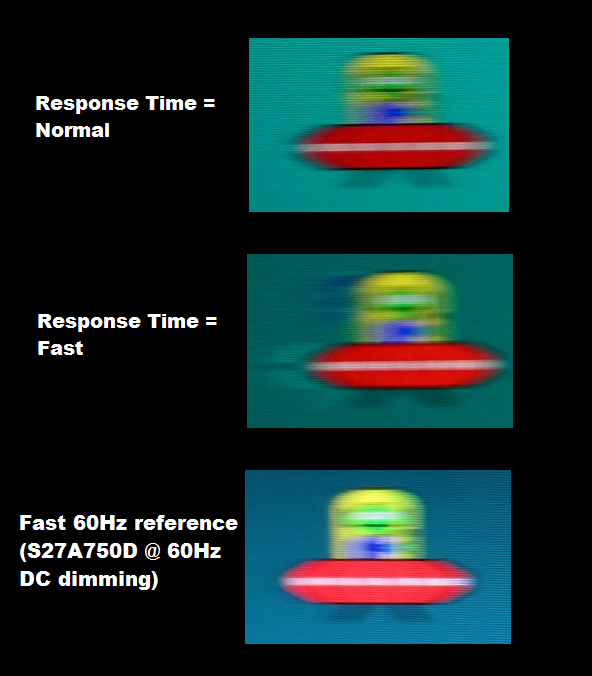
Pursuit photographs were taken with a sensitive camera using the UFO Motion Test for ghosting. The test was set to run at 960 pixels per second – a practical speed for such photographs and one which allows weaknesses to be highlighted. The middle row of the test (light cyan background) was used with both ‘Response Time’ settings tested; ‘Normal’ and ‘Fast’. The image below shows these results alongside a ‘Fast 60Hz reference’. This is a Samsung S27A750D set to full brightness (avoids PWM), running at 60Hz with its optimal response time setting. This reference shows how things should look where it’s only motion blur due to eye (camera) movement that is a noticeable limiting factor. Using the ‘Normal’ response time setting gave just a little bit of extra trailing on top of the perceived blur from eye movement (i.e. fast 60Hz reference) but was really very close overall. The ‘Fast’ setting, on the other hand, introduces extremely obvious overshoot (inverse ghosting) that makes the setting pretty much unusable. It is clear from this analysis that the ‘Normal’ setting is optimal. In our game testing below we look at a much broader range of pixel transitions. Here there are some weaknesses in places that aren’t highlighted in this test and indeed weren’t highlighted properly using the top (dark cyan) or bottom (light cyan) row of the test either. On Battlefield 4 (BF4) there was a moderate degree of blur, largely attributable to eye movement and as you would expect to see on even the fastest 60Hz LCDs. Where various medium-dark shades moved against one another (for example, moving through shaded patches of vegetation) there was a little bit of extra trailing on top of this, but nothing substantial. The vast majority of transitions occurred fast enough for optimal 60Hz performance. There was also a bit of overshoot in places, but this was quite light and only affected a slim minority of transitions. It’s not something that we feel even users sensitive to overshoot should worry about. On Dirt Rally there was moderate blur even during gentle cornering, but quite a similar level to what you’d expect to see on even the fastest 60Hz LCDs overall. Again, there was a little bit of additional trailing on top of this for some transitions between dark and medium shades in particular, but this was really quite a minor addition to the overall perceived blur. There were also some traces of overshoot here and there, but nothing that stood out in an obvious way. We also tested out a few Blu-ray movie titles and can confirm that no specific weaknesses attributable to pixel responsiveness could be observed. There was no noticeable overshoot nor any trailing observed from slower than optimal pixel responses. The fluidity of this content was limited by the 24fps or so frame rate at which it ran, however. If a user doesn’t have the graphical grunt to run the native 2560 x 1440 resolution on all applications (for example, certain games) then it may be tempting to consider switching to a lower resolution such as 1920 x 1080 (Full HD or ‘1080p’). This may also be required if you wish to connect up an alternative device such as a games console to the monitor. Running the monitor at a lower resolution makes use of an interpolation (scaling) process. For AMD GPU users this is automatically handled by the monitor when gaming, by default. Nvidia users should open the Nvidia Control Panel and navigate to ‘Display – Adjust desktop size and position’. They should ensure that ‘No Scaling’ is selected and ‘Perform scaling on:’ is set to ‘Display’ as shown below. The interpolation process used by the monitor is surprisingly good. Running the monitor at 1920 x 1080 does give a softer look to the image than running 1920 x 1080 natively on a monitor of similar size. The softening is far less pronounced than on many monitors running the resolution interpolated in this way, though, and is vastly superior to the alternative GPU scaling. It does not look like you’re observing the game world through a soft-focus lens and a decent degree of the native sharpness and texture detail is retained. 1920 x 1080 is therefore quite useable on this monitor, despite the somewhat softer look than a native 27” 1920 x 1080 display. As noted in the OSD video earlier, there is also a ‘1:1’ pixel mapping feature if you prefer a completely undistorted/unscaled picture in the centre of the screen. If you’re viewing movies using software on the PC and keep the monitor at 2560 x 1440, the GPU or movie software will use an upscaling process. This leads to slight softening of the image compared to running the movie on a Full HD display, quite comparable to the softening from the monitor’s interpolated 1920 x 1080 resolution really. For users looking for a screen of modest size that will offer a good amount of ‘desktop real-estate’ without scaling becoming an absolute must, the 27” WQHD (2560 x 1440) models are quite attractive. They also offer a decent pixel density for gaming. Most are restricted to displaying colours within the sRGB colour space. The Dell UP2716D, on the other hand, offers far greater ‘colour capacity’. The screen was very nicely calibrated ‘out of the box’ with respect to a number of different colour spaces – going beyond just sRGB and Adobe RGB and offering good emulation for work or viewing within DCI-P3 and Rec. 709. The screen also offered excellent flexibility in its ‘Custom Color’ mode, allowing for a nice balance to be struck for vibrant but not completely overblown colour representation for ~sRGB content – according to user taste rather than stringent standards. With this, colours showed exceptional variety and looked vibrant but generally well-represented. It wasn’t possible to get the image presented quite as it would be on enhanced phosphor standard gamut WLED models (like the Dell U2715H) due to a bit of underlying extra saturation. The contrast performance was also pleasing overall, save for the usual ‘IPS glow’ eating away at peripheral detail. The screen surface was very smooth and light whilst static contrast was as good as we’ve seen from an IPS panel. This allowed bright elements to stand out well in surrounding darkness and appear smooth (free from obvious graininess). For users who value strong uniformity for lighter shades, the ‘Uniformity Compensation’ feature (available with certain restrictions) worked very well to help enhance both luminance and colour temperature uniformity. In terms of responsiveness, this monitor was no slouch either. This would perhaps surprise some given that this certainly isn’t designed as a ‘gaming monitor’ or anything of that ilk. There was very little input lag to speak of and the grey to grey acceleration using the default ‘Normal’ response time setting provided quite a good balance overall. There was minimal trailing and overshoot, with motion blur levels that are pretty much as low as you can expect from a 60Hz LCD. The design and port selection of the monitor, plus the brand reputation of Dell, make this monitor quite an attractive package all around. We wouldn’t say it’s worth paying extra for over something like the U2715H, unless you specifically need its enhanced colour capabilities or like a vibrant but varied look when gaming at the expense of accuracy. The bottom line; a capable all-round performer with excellent colour space flexibility and a welcome addition to the UltraSharp series.
Perceived blur with various settings
Responsiveness in games and movies
Interpolation and upscaling

Conclusion
Positives Negatives Pleasing image setup and excellent flexibility under a range of colour spaces – the choice of vibrant but varied colour output for general purpose or greater workflow specific colour accuracy. Hardware calibration is also supported
No support for ‘future’ colour gamuts such as Rec. 2020 and no ability to display colours in quite the same way as a standard gamut enhanced phosphor WLED model
Pleasing static contrast performance for the panel type, a very smooth and light matte screen surface and a useful ‘Uniformity Compensation’ (UC) setting
The usual ‘IPS glow’ is present and the luminance uniformity of our unit wasn’t great without UC enabled – this comes at the expense of contrast can only be enabled in certain presets without adjustments made beyond brightness, really Low levels of input lag and a decent balance to the pixel responsiveness overall, providing perceived blur that’s about as good as you can expect from a 60Hz LCD
There was some additional trailing on top of this and also a bit of overshoot in places – plus a limitation of 60Hz for the refresh rate, which won’t be to everyone’s liking
A simple modern design with strong ergonomic flexibility, plenty of features and a useful 2560 x 1440 resolution for both work and play. Plus, some of the best interpolation we’ve seen for displaying Full HD on a WQHD model
The flexibility and colour performance on offer comes at a price premium and won’t suit everyone’s budget (or indeed needs, which goes without saying really)
![]()