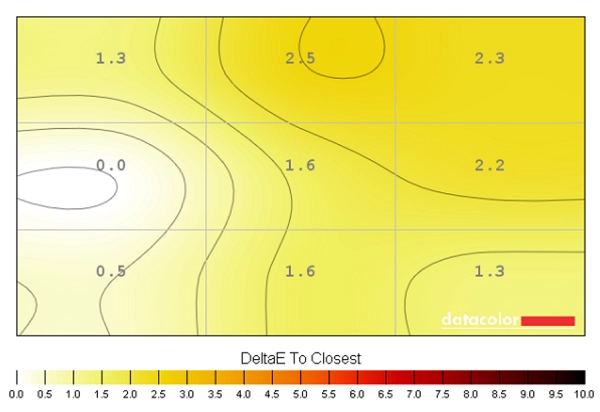
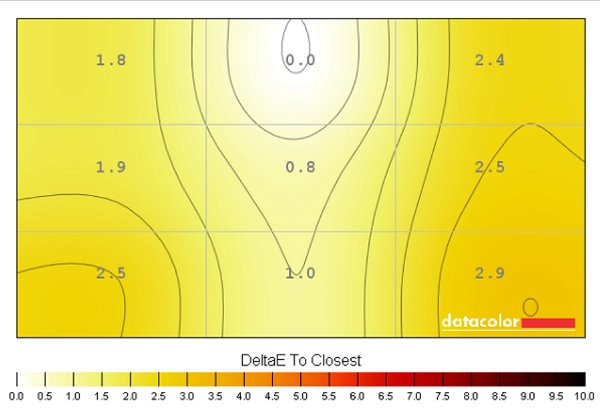
The results here are good, with no significant deviation between the recorded points and the desirable 6500K daylight target. The highest deviation recorded using our test settings was a DeltaE of 2.3 (‘quadrant 3’ towards the top right) and using UC was a DeltaE of 2.9 (‘quadrant 9’ towards the bottom right). The average (mean) DeltaE was around 1.67 using our test settings and around 1.98 with UC enabled. Again, it doesn’t seem that the UC mode is having a positive effect, at least not on our unit. Fortunately the performance was quite pleasing under our test settings anyway, without this feature.
Contrast in games and movies
The monitor put in a respectable contrast performance on Battlefield 4. Visibility in dark scenes was largely as it should be, with the exception of some peripheral detail being lost due to IPS glow. Some fairly minor details could be observed in more central regions of the screen not affected by IPS glow. Bright elements contrasted well with their dark surroundings. The distinction between closely matching light shades was also strong – they didn’t appear bleached nor did they take on an inappropriate tint. Some of these light colours, particularly where single static bright shades dominated (i.e. a light shining through the night), appeared a little grainy due to the screen surface. This was not the smeary or ‘dirty’ appearance that accompanies some stronger matte surfaces but wasn’t as ‘clean’ as we’ve seen from some ‘semi-glossy’ surfaces, either.
The contrast was good overall on Dirt 3. There was again some detail lost due to IPS glow, particularly towards the bottom two corners of the screen from a normal ergonomically correct viewing position. This made some subtle detail such as material textures inside the car and tire tread patterns difficult to see at times. Elsewhere detail levels were respectable and overall the distinction between ‘light’ and ‘dark’ and more subtle distinctions between was good. There was again slight graininess visible on light shades (particularly bright headlights at night) due to the screen surface.
The contrast performance was good on the Blu-ray of Skyfall. Dark scenes exhibited a good level of detail, with the aspect ratio of the film giving black bars at the top and bottom which ‘soaked up’ much of the IPS glow. Bright elements contrasted well, with the neon lights in Shanghai and candles floating along the river at night in Macau looking quite punchy.
Lagom contrast tests
We used Lagom’s tests for contrast to help highlight slight weaknesses in the contrast performance of the monitor, some of which may not be obvious during other testing. We observed the following.
- Performance on the contrast gradients was excellent with distinct brightness steps in all cases.
- Performance on the black level test was good. The first two blocks were perhaps a little more distinct than they ideally should be (for a monitor following ‘2.2 gamma’) but the blocks were generally represented as they should be. The viewing angle had little influence on the colour temperature, which remained a good neutral grey and showed appropriate distinctiveness throughout the range. There was no noticeable dithering.
- Performance on the white saturation test was excellent. All checkerboard patterns were visible and the grey patterns were appropriately neutral. The final pattern was a little less visible than it could be, shrouded somewhat by the slight graininess of the screen surface.
- The greyscale gradient was exceptionally smooth. There was no obvious dithering, perhaps some hints here and there but it was extremely well masked and not really visible under normal viewing conditions. The lightest shades didn’t appear as ‘clean’ and ‘pure’ as they might when viewed on a monitor with a smoother screen surface, but didn’t appear overly grainy either.
Colour reproduction
Colour gamut
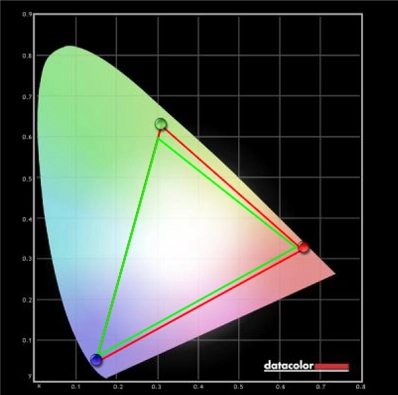
The Dell P2415Q offers complete coverage of the sRGB colour space and a bit of extension beyond, as shown in the following gamut representation. This slight extension invites a little extra vibrancy in places without things looking unnatural or completely oversaturated.
Colour in games and movies
The monitor showcased a pleasing variety and quality to colours on Battlefield 4. Things looked much as they should, with environments showing an array of rich greens and browns alongside more muted shades. There were plenty of vibrant shades, where appropriate, such as; warming orange fires, bright red and yellow paints, good bright greens for aircraft HUD elements and brilliant bright cyans for in-game markers and the engineer’s blowtorch. Some of these colours were quite striking in their richness, which was good to see.
The colour performance was also pleasing on Dirt 3. The range of subtly different green, brown and red shades within the environments was excellent and brought a good natural look to them. There were plenty of dashing vibrant colours, too, especially noticeable on the car liveries and advertising around the track. Bright pinks, deep reds, strong deep blues and bright cyans were amongst some particularly striking shades. The screen surface helped preserve a decent degree of vibrant ‘pop’, but lacked the smoothness of some screen surfaces which would give colours that ‘painted onto the screen’ look.
The monitor also provided an impressive range of appropriately represented colours on Elder Scrolls Online (ESO). There was a good range of natural greens and earthy browns, giving the environments a good natural look. Good and consistent neutral greys and mossy greens were also displayed, for example on some of the rocks and mountainous environments. Ornate buildings and structures showcased an impressive variety of woody shades as well with even very subtle variations in shade displayed appropriately. There were plenty of nice vibrant elements as well, such as impressively deep red spell effects and vibrant-looking orange flames.
The Blu-ray of Skyfall was also represented well in the colour department. Skin tones, greens and browns from vegetation and buildings showed appropriate saturation levels – looking rich but realistic. Explosions, bright paints and the neon lights of Shanghai showcased some impressively deep shades with a good rich look – with deep reds and purples being particularly impressive here.
We also observed the colour reproduction on the Blu-ray of Futurama: Into the Wild Green Yonder. With its eclectic mix of pastel shades, deep shades and neon shades coupled this is a good test for the colour reproduction of a monitor – more so given that large areas of a single shade often fill the screen, allowing weaknesses in consistency to be readily analysed. The P2415Q put in a pleasing performance here, showing a nice range of muted shades alongside plenty of ‘loud’ neon shades and good deep shades. Bright bold pinks, luminous neon greens and deep reds were displayed particularly well. The consistency of shades was also very strong, with the saturation maintained throughout the screen. This allowed the monitor to distinctly display subtly different pastel shades (such as skin tones) and kept colours appropriately rich regardless of on-screen position.
Viewing angles
Lagom’s tests for viewing angle were used to analyse the viewing angle performance and colour consistency of the monitor more closely. The following observations were made from a normal viewing position (70cm from the screen in our case).
- The purple block appeared a consistent light purple throughout without any obvious pink sheen. There was a slight pink hue towards the very edges but nothing severe.
- The red block was a rich and fairly striking red throughout.
- The green block appeared lime green throughout. This was quite consistent without any noticeable yellowing or deepening of the green.
- The blue block was a good royal blue throughout.
- The Lagom text appeared a blended grey throughout without green or red flashes. This indicates a low level of viewing angle dependency to the monitor’s gamma curve and is what you would hope for from an IPS panel. The following video shows the results of this test from a variety of viewing angles, as well as a mixed and dark desktop background. The dark desktop background highlights how the IPS glow blooms out as viewing position is altered relative to the screen.
Responsiveness
Input lag
We used a sensitive camera to compare the latency of the monitor, using our test settings, with a range of displays where the latency is known. To assist in this, a small tool called SMTT 2.0 was used. Using this method we calculated 11.85ms (under ¾ of a frame) of input lag for the Dell P2415Q. This was not altered by using the ‘Game’ mode of the monitor. This value takes into account not only the component of input lag that you ‘feel’, known as the signal delay, but also the component that you ‘see’ (i.e. it is influenced by pixel response time). This indicates a relatively low signal delay which is especially pleasing to see on a ‘4K’ monitor such as this. We feel that even users who are quite sensitive to latency should find this monitor quite good for a 60Hz model in that respect.
Pixel responsiveness
We used the UFO Motion Test for ghosting and a highly sensitive camera to assess the pixel responsiveness of the monitor. This test was set to run at a speed of ‘3840 Pixels Per Sec’, meaning that the UFO travelled rapidly across the screen, traversing it in 1 second. The following image shows the pixel response of the monitor using both its ‘Normal’ (first column) and ‘Fast’ (second column) ‘Response Time’ settings. The top row in our image corresponds to the first row of the test, which has the UFO moving against a relatively dark cyan background. The bottom row in our image corresponds to the middle row of the test, showing the UFO moving against a medium cyan background.
The final column in this image shows the results from a Samsung S27A750D set to ‘Faster’ and running at 60Hz. This indicates how the test looks on a very fast but artifact-free model with a TN panel. Note that the separation distance between the original object and any trails is lower on the Samsung because it was set to a speed of ‘1920 Pixels Per Sec’. This gives a like-for-like transition on both monitors, as it ensures that the UFO is travelling at the same speed, matching the respective resolutions of the monitors.
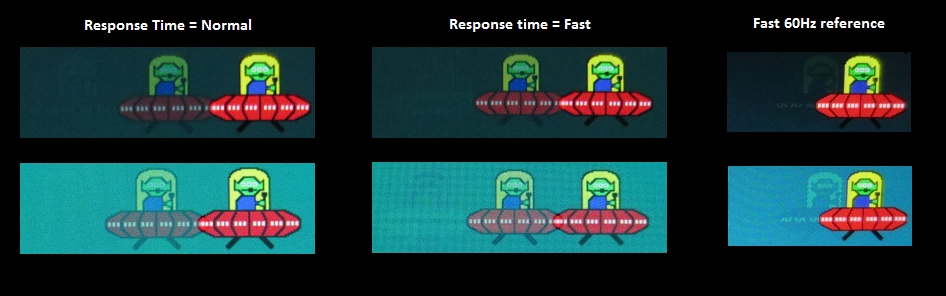
Regardless of the ‘Response Time’ setting, the Dell produces a bold primary trail for both sets of transitions (top and bottom row). In contrast, the fast 60Hz reference produces quite a faint primary trail. There is also a very faint secondary trail, particularly noticeable on the darker background. The nature of this secondary trail changes if you increase the response time setting from ‘Normal’ to ‘Fast’. It becomes inverted, indicating that the grey to grey acceleration being applied is too aggressive, giving overshoot and an inverse ghosting effect. An important take-home message from this test is that it gives a decent impression of how rapid and ‘artifact free’ (or not) the pixel transitions being analysed are. It is clear that the fast 60Hz reference is performing these transitions more rapidly, as the trailing is much weaker. It is also clear that the ‘Fast’ response time provides a bit too much acceleration, giving moderate overshoot. We found the ‘Normal’ setting preferable for the inverse-ghosting free experience and found the ‘Fast’ mode too aggressive without providing any real benefit in practice.
What is of pivotal importance, though, is that your eyes do not perceive motion on a monitor in the same way as a camera does when taking a photograph. As this article explores in great detail, the movement of your eyes creates a significant level of motion blur. This is particularly true on a 60Hz ‘sample and hold’ monitor (your typical LCD) such as this. Once you consider the masking effect that this blur has on pixel response times and also that different pixel transitions (involving different shades) can occur at quite different speeds, this test seems a bit limited. That’s why we also like to bring everything together by analysing the performance ‘in the real world’ using some familiar game titles and also some movies.
Responsiveness in games and movies
On Battlefield 4 there was a moderate degree of blur, with the movement of your eyes being by far the most significant contributor to this. The level of motion blur was really surprisingly similar to even the fastest 60Hz monitor (including our fast reference screen which we compared side-by-side throughout). The ‘4K’ (UHD) models with 28” TN panels have some stand-out transitions which occur noticeably more slowly than others. On these models a more noticeable extended trail can be seen on top of the motion blur caused by eye movement in certain circumstances. When strafing past a dark grey helicopter rotor blade with light grey or white clouds in the background, for example. That didn’t seem to be an issue on the P2415Q with such transitions occurring fast enough to spare any additional trailing. There was no evidence of overshoot either, which is good.
Dirt 3 told a similar story. Right across the range of pixel transitions things were much in-line with the fastest overshoot-free 60Hz LCDs when it came to motion blur. There was a moderate degree of blur noticeable when cornering in particular and a resulting loss of sharpness to textures during movement, but this occurs on all 60Hz LCDs. Even during the fast-paced Gymkhana mode with its insane spins and other manoeuvres, things were much as you’d see on what is technically a much faster 60Hz monitor. There was no evidence of inverse ghosting during any transition, either. The performance on this AH-IPS panel was really quite pleasing given what the weaknesses we’ve seen on other 4K models with both TN and IGZO IPS-type panels.
We also observed the motion performance on our Blu-ray movie titles. As I’m sure you can predict, performance here was really as good as you can hope for from a 60Hz LCD. The pixel responses didn’t cause any issues with trailing or inverse ghosting, although the fluidity of the films is limited by their frame rate (~24fps).
The ‘4K’ UHD experience
In this article we looked at some of the trials and tribulations of running the ‘4K’ UHD resolution of 3840 x 2160 on a 28” monitor. This is of course a 23.8” screen, which gives a greater pixel density of 185.12 PPI (Pixels Per Inch) compared to an already impressive 157.35 PPI. A lot of this article still applies just as much to this model as the 28” (and indeed 27” screens), however. We will work on the assumption that you’ve read and understand that article, but will briefly expand on some of the key concepts with examples on the P2415Q.
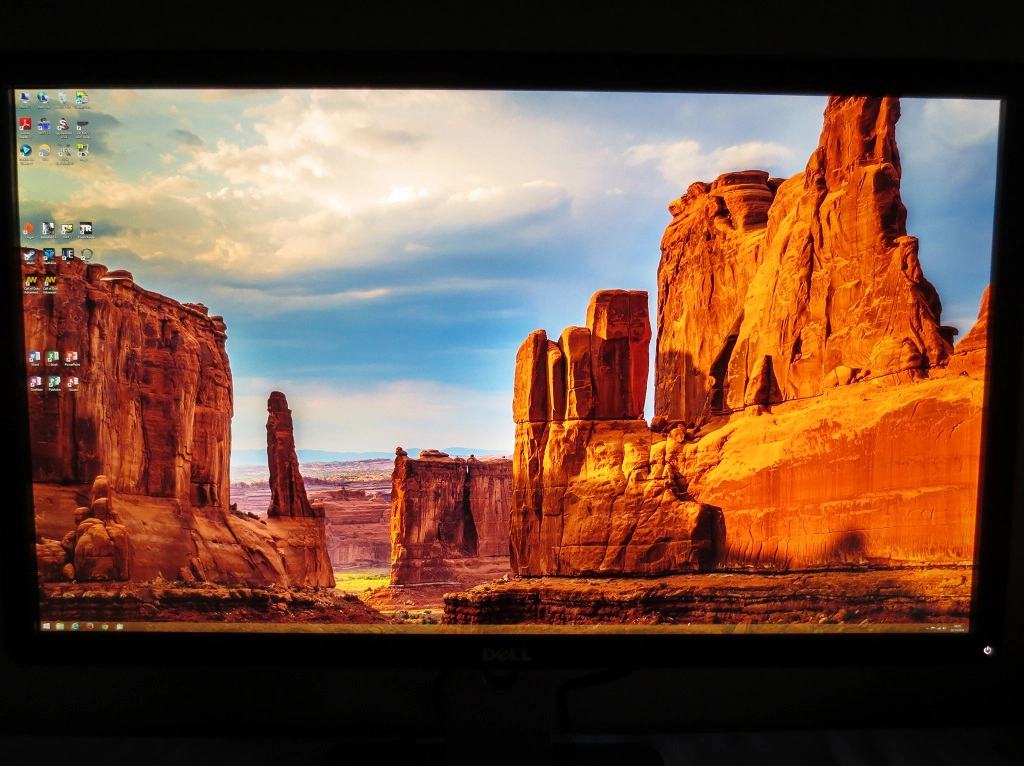
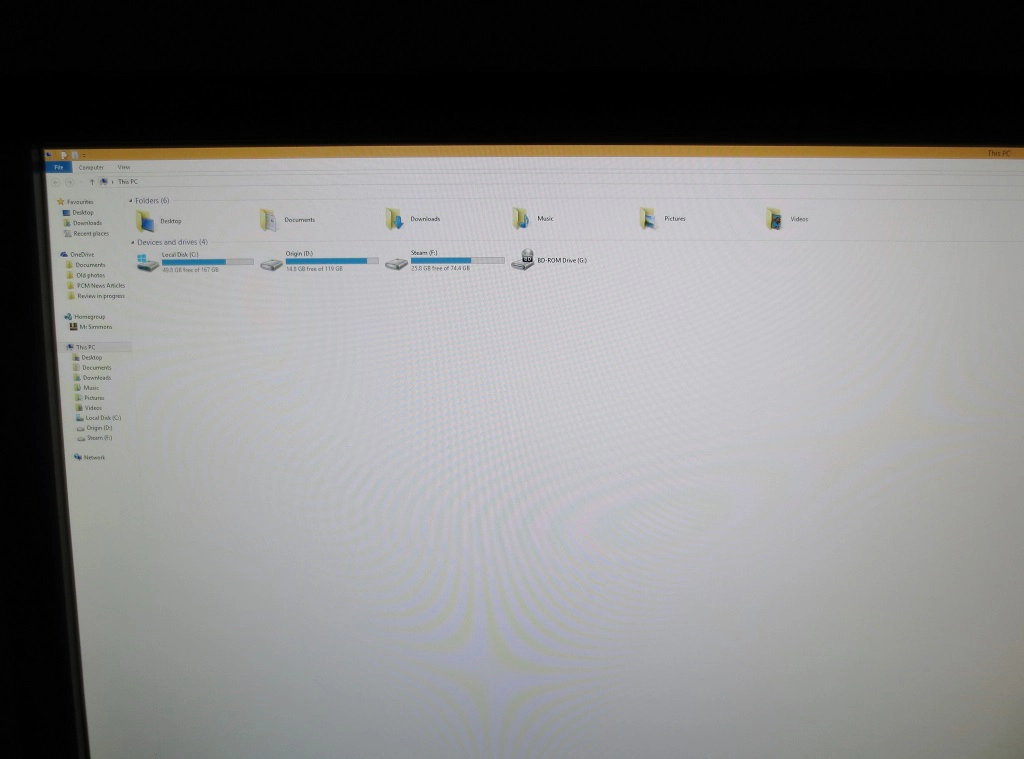
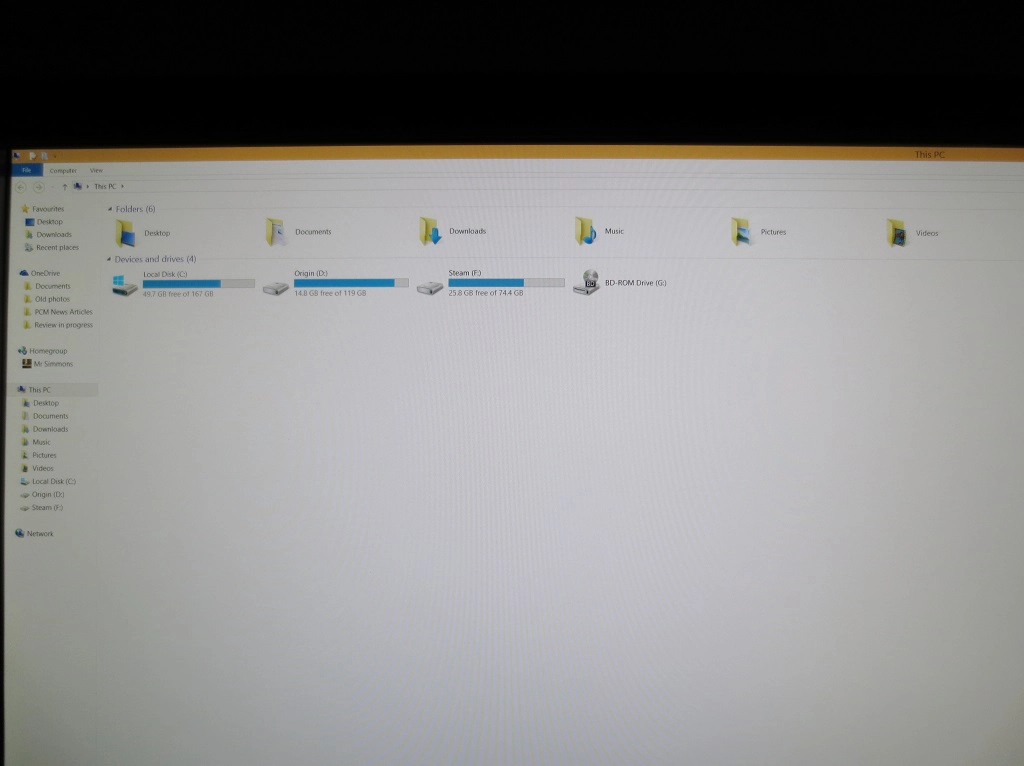
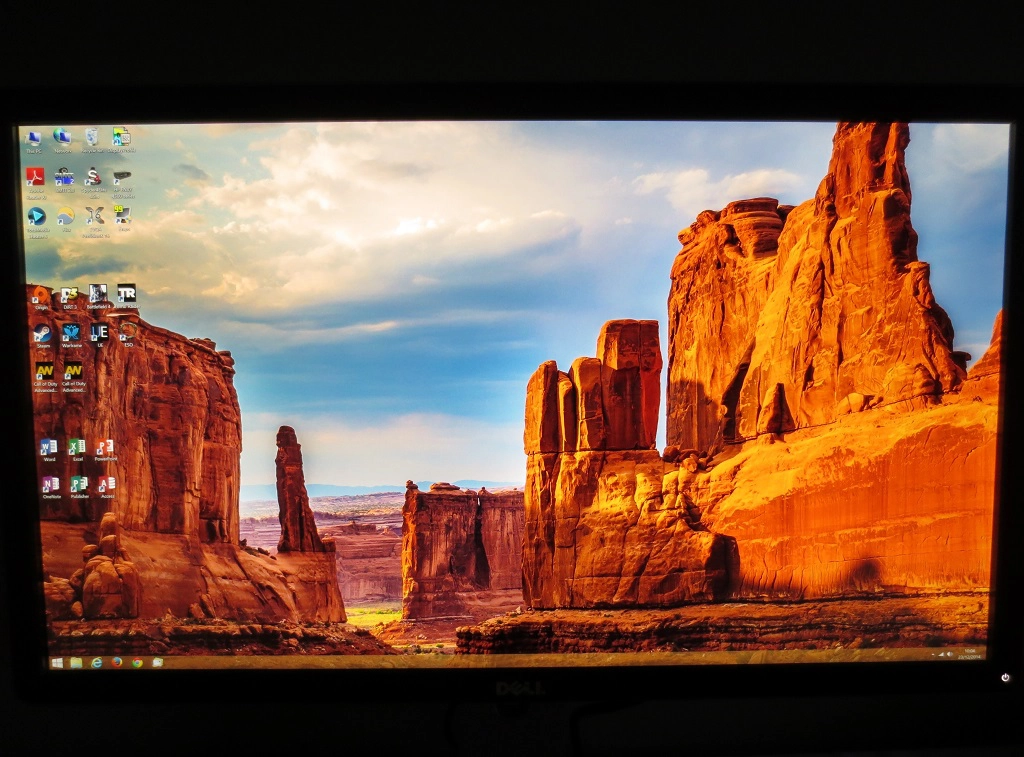
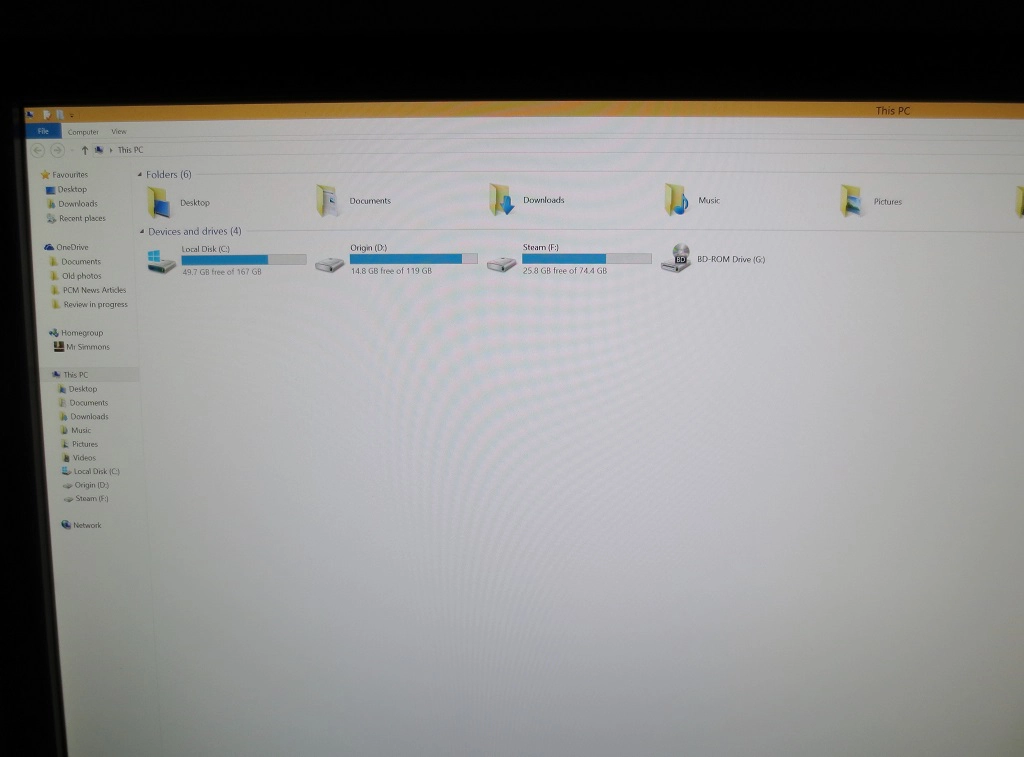
Windows 8.1 and possibly newer versions (such as Windows 10) automatically apply scaling to the desktop when a UHD monitor such as this is detected. We would recommend playing around with the scaling settings, which can be found in ‘Control Panel – Appearance and Personalisation – Display’ (refer to our ‘experience’ article for further information). If you select ‘Smaller – 100%’ then everything is displayed natively. You will notice that desktop elements such as icons and the taskbar are truly tiny, as are elements in the File Explorer. The amount of content that can be displayed on this relatively small screen is phenomenal.
If you select ‘Medium – 125%’, things become just a little larger but are still rather tiny. If you recall, this was our preferred setting on the 28” models – but is really too diminutive for our taste on this 23.8” screen.
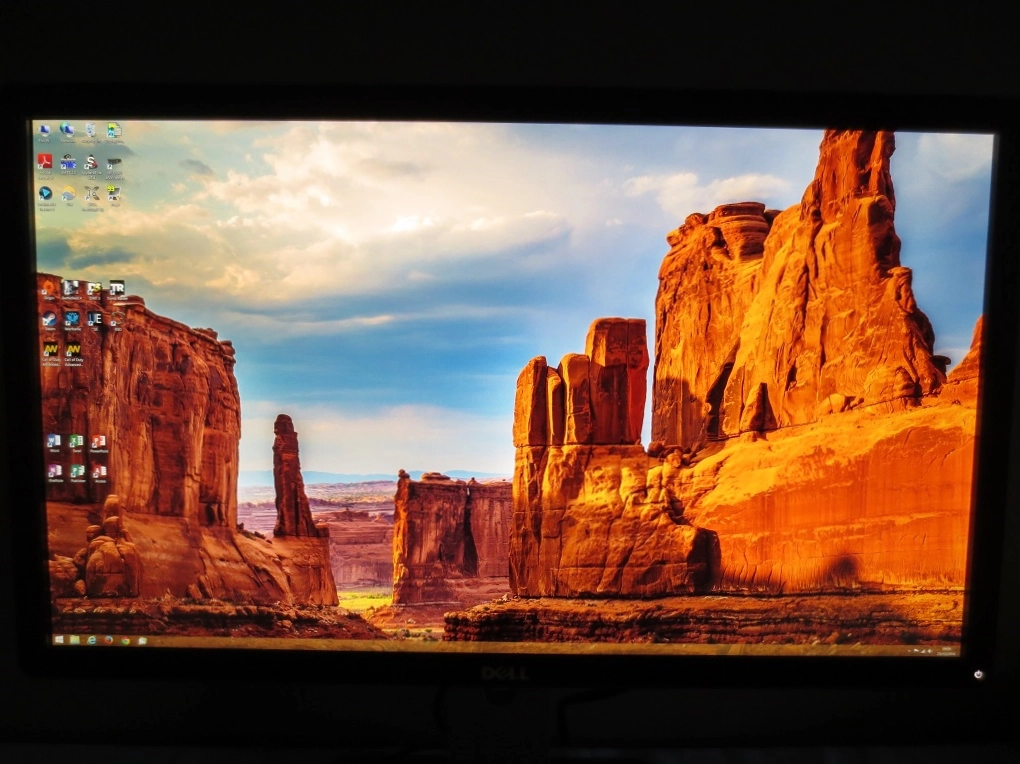
The ‘Large – 150%’ setting provided a comfortable size for our eyes, similar to ‘Medium – 125%’ on the 28” models. Things were still rather diminutive but we didn’t find reading things to be a strain (this will of course depend on your preferences and eyesight). The Windows elements still had a really high resolution feel to them, scaling cleanly with good clarity.
Scaling is of course a key issue that is looked at in some detail in our ‘UHD experience’ article. Not everything scales cleanly or indeed at all. The following image shows three popular ‘gaming clients’. At the top left is AMD’s Raptr and underneath that is Valve’s Steam. At the right of the image is EA’s Origin.
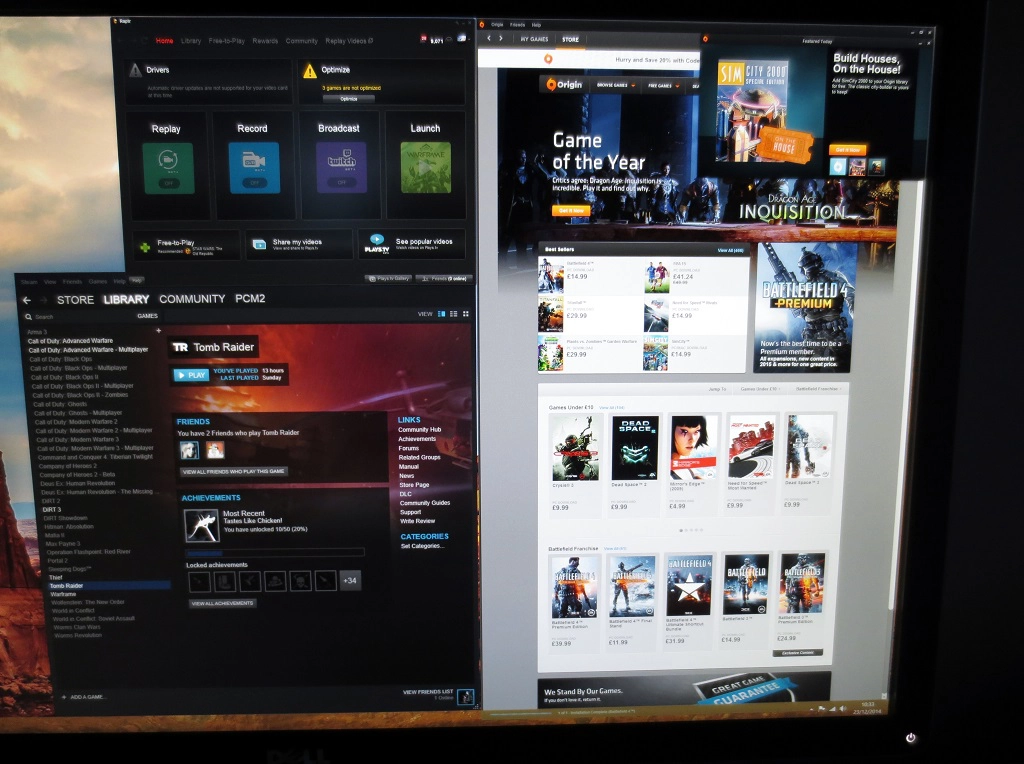
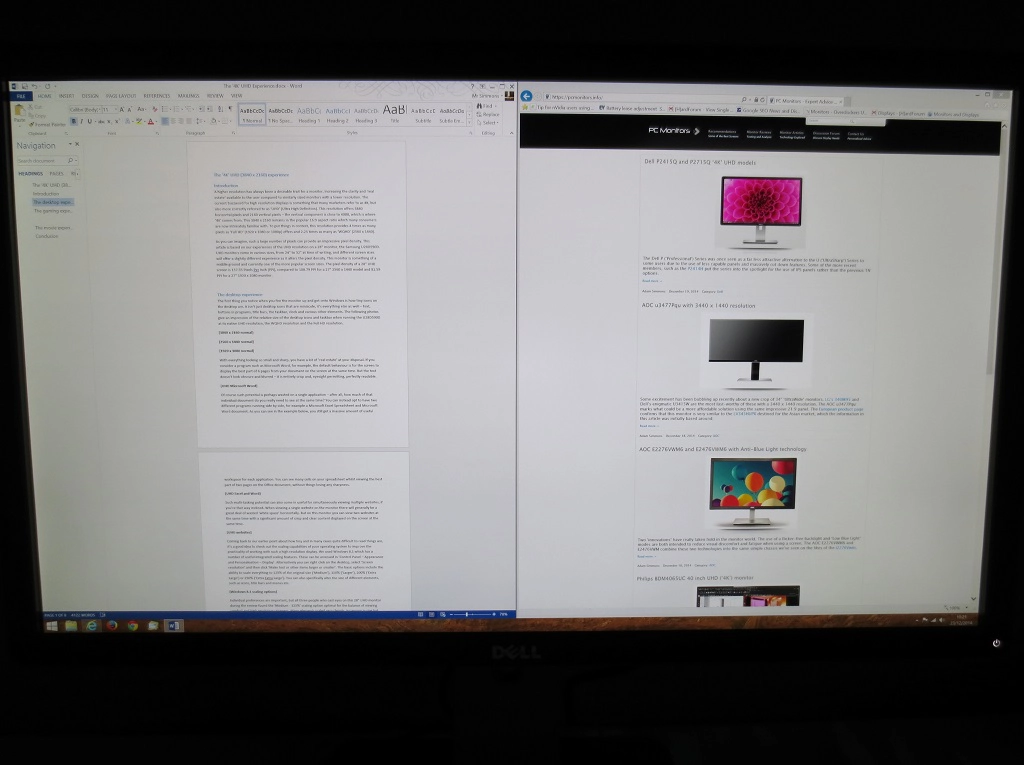
Both Raptr and Origin refuse to scale at all, leaving some truly tiny text and navigational elements. Steam sits on the opposite end of the spectrum. It does scale according to the relevant Windows setting, but it doesn’t do so in a ‘clean’ way and looks a bit blurry and not as crisp as it should. This isn’t clear from the image, that’s just there to set the scene. Many applications, including Microsoft Office programs and web browsers, allow the user to control the zoom level independently of any scaling that is applied in Windows. The immense amount of screen real-estate really comes into its own on these sorts of applications, giving superb productivity potential and paving the way for efficient multi-tasking. Below you can see Microsoft Word open alongside Internet Explorer, each with an immense amount of content being displayed at once. Although not captured in the image, text and images remain very sharp even if rather small.
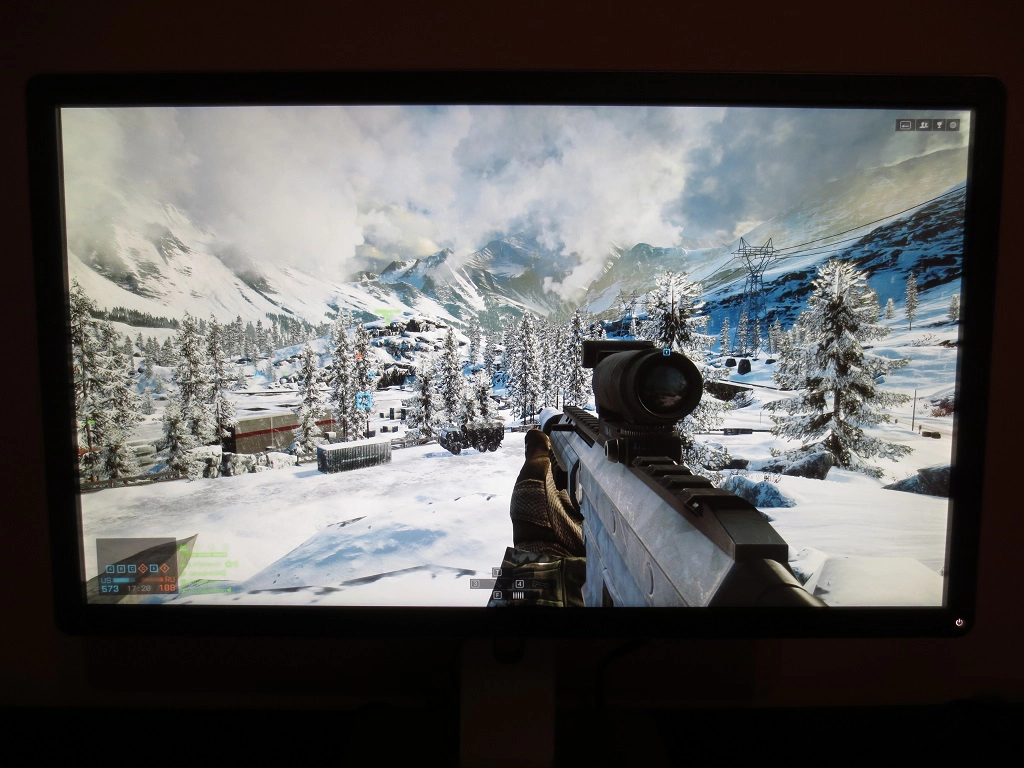
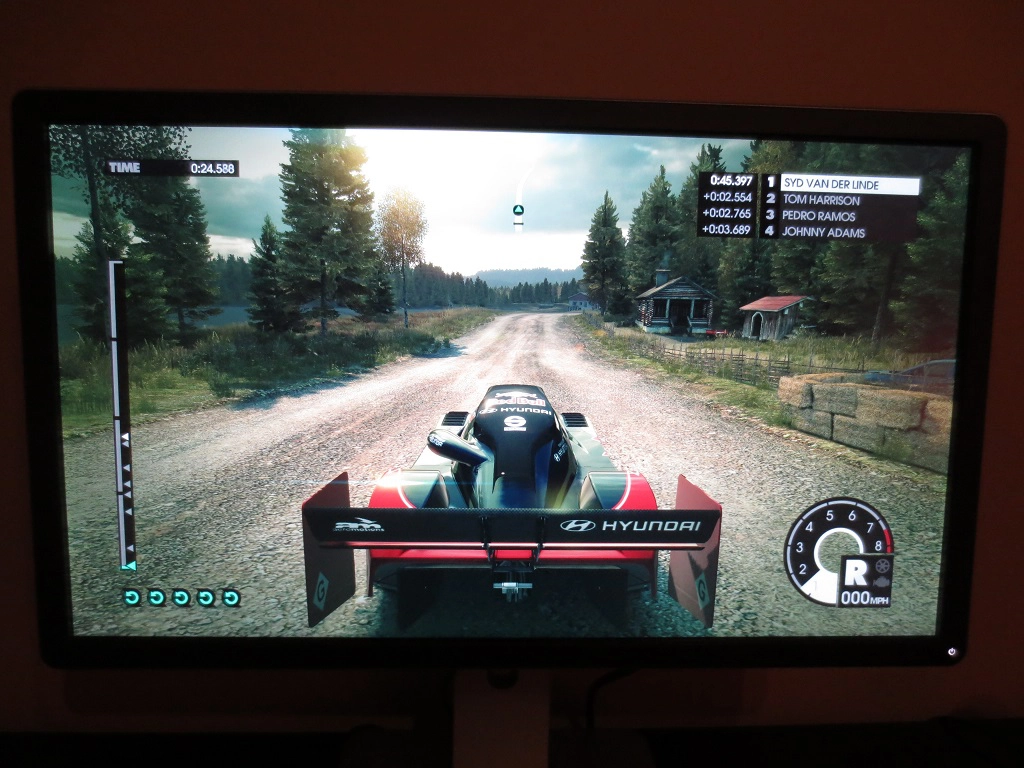
Another thing which really can’t be shown in images is the immense amount of detail that can be brought to games when running them at the UHD resolution. Here are some images showing the monitor in action on a couple of game titles – not representative of what you see first-hand, but we know people like to see images like this anyway.
As noted in our infamous article, there are only some elements which really take full advantage of the resolution – it’s highly game and texture dependent. The overall crispness is excellent, though, and the detail far into the distance is superb. From a normal viewing distance, which in our case is around 70cm, the level of detail is actually very similar to on the 28” ‘4K’ screen that the article focuses on. The pixel density is already so high that the differences are only really obvious in-game if your nose is practically touching the screen. Even from fairly close up (say 40-50cm) the experience was very similar in terms of the crispness and detail of the games.
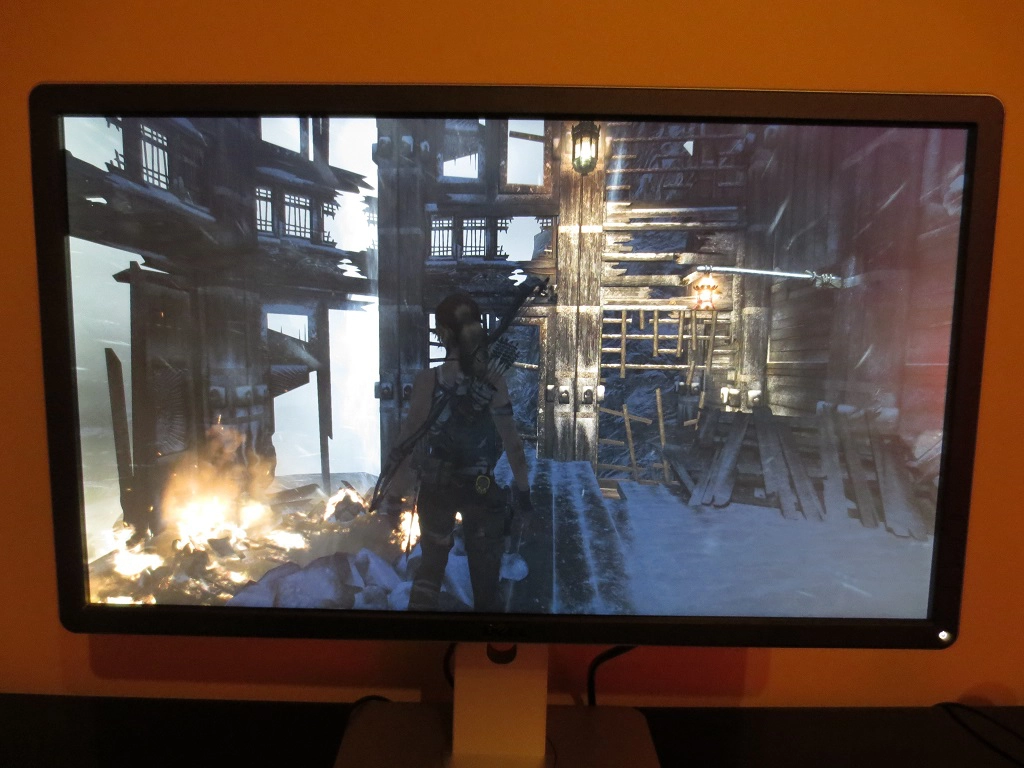
To use a specific example which wasn’t used in the article, Tomb Raider (shown above) looked very impressive overall in ‘4K’. There were many painted wooden textures and some rock faces that showed very impressive detail even if you are very close to them on the game. There were then some textures that appeared very crisp and detailed until you got particularly close to them. Buildings generally had an excellent level of detail from the usual third person perspective, but lacked detail if you zoom in (i.e. aim with a weapon). Some other textures never looked particularly detailed regardless of whether you were zoomed in with a weapon or observing from a third-person perspective.
It’s also worth noting that the need for anti-aliasing is greatly reduced with this sort of pixel density – although it is not entirely eliminated. On all of the game titles we tested, which include the titles shown in the screenshots above and those mentioned in our original article, most objects appeared to have very smooth and well-defined edges. There is a slight shimmering effect and some jagged edges on thin objects such as wires, poles and posts. This is particularly true when such objects are rendered in the distance and therefore appear thinner. In this respect we didn’t feel the extra pixel density of this monitor over the 28” UHD model really made a difference. The same areas of games appeared smooth even without anti-aliasing whilst the same objects exhibited aliasing which became more noticeable with movement. We do accept that some users dislike even small amounts of aliasing whilst others wouldn’t really notice this – certainly not as much as the hit in frame rate that comes with enabling anti-aliasing at such a resolution.
Movies are another area that the ‘4K’ resolution can really enhance, by providing immense amounts of detail. In this respect things were exactly as they were on the 28” model used for our article. This is really an area where we expect to see immense growth in the coming months and years. For now, though, the amount of ‘4K’ movie content available is extremely limited. Netflix doesn’t currently support such content for PC users, Amazon Instant Video lacks such content at the moment and Blu-rays are currently limited to the Full HD resolution of 1920 x 1080. We really enjoyed watching UHD content on YouTube – it had just the same ‘wow’ factor as on the 28” UHD screen but didn’t really gain anything from the increased pixel density at a normal viewing distance.
Interpolation and upscaling
The 3840 x 2160 resolution is quite demanding when gaming and indeed you may wish to use the monitor with a games console or other such device that is limited to a lower resolution, such as 1920 x 1080. This monitor has a number of different ‘Aspect Ratio’ settings in the ‘Display’ section of the OSD. We’ve demonstrated these settings in the OSD video featured previously, but just to remind you we’ve included the relevant section of that video below.
As you can see the ‘1:1’ mode ensures that only the pixels specified in the resolution (for example 1920 x 1080) are actually used and therefore the image is crisp and undistorted. The obvious downside is that running the 1920 x 1080 resolution provides a rather diminutive image (12” diagonally and maintaining the 16:9 aspect ratio). Selecting a resolution of 2560 x 1440 fills 16” of the screen diagonally, again in the 16:9 aspect ratio.
The other main mode to consider, particularly for these two resolutions, is the ‘Wide 16:9’ mode. This ensures that all 3840 x 2160 are used to display an image, with an interpolation process used to transpose the chosen resolution onto those pixels. It is a common misconception that running 1920 x 1080 on a ‘4K’ UHD monitor will automatically provide equivalent sharpness to a native 1920 x 1080 display. That belief is held because the UHD resolution has exactly twice as many pixels vertically and twice as many pixels horizontally as the Full HD resolution. In practice monitor interpolation processes aren’t perfect.
In the case of the Dell P2415Q, though, the interpolation process is surprisingly good. In fact we’d go as far as to say it’s excellent. If you run the monitor at 2560 x 1440 (WQHD) or 1920 x 1080 (Full HD) then you do lose a degree of sharpness compared to running that resolution on a 23.8” model that has a similar screen surface. This loss of sharpness is fairly minor, though, and is in fact one of the lowest losses of sharpness we’ve seen from an interpolation process on any monitor. On the desktop text looks a little soft but not really blurry as you’d usually observe from a normal viewing distance. When looking at images or playing games the monitor seems to capture a lot of the detail you’d expect when running the resolution natively. This interpolation performance is much better than we’ve seen on other ‘4K’ UHD models and we feel makes the monitor rather flexible.
If you run a Blu-ray movie or other film content on the monitor via software on the PC, you’d generally keep the monitor at its native 3840 x 2160 resolution. If the movie content is a lower resolution than that (for example 1920 x 1080), then the GPU or software is responsible for upscaling it. The monitor doesn’t have a say in this process. Fortunately things worked very nicely for the 1920 x 1080 movie content we watch. There was an inconsequential loss of sharpness compared to running the same content on an otherwise equivalent 1920 x 1080 display. Things looked much as they should.
Conclusion
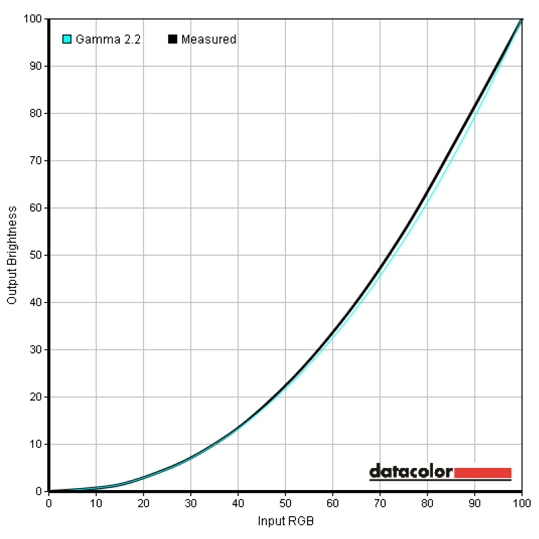
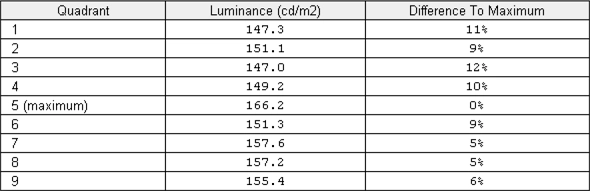
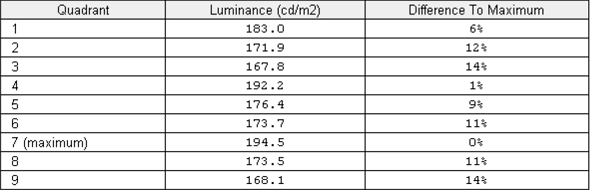
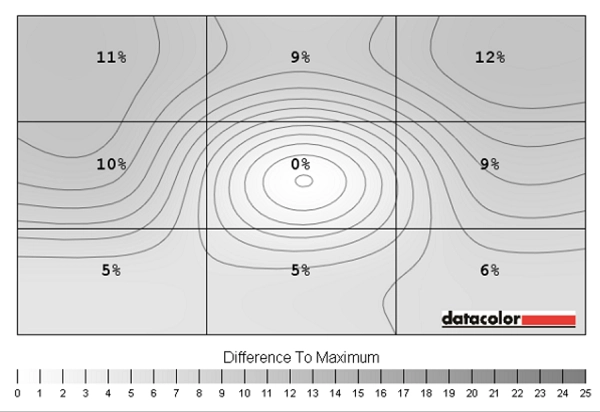
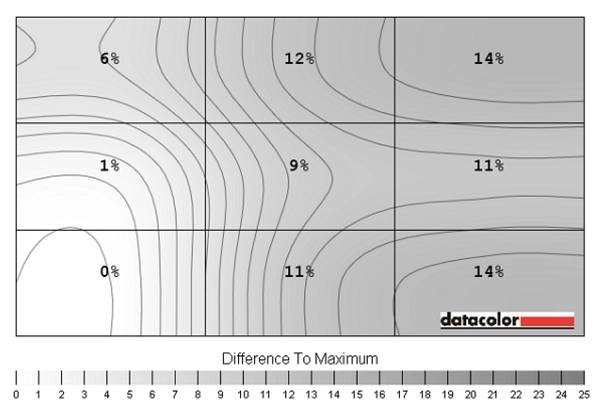
Leaving aside the resolution for the moment and looking at it like we would any other monitor, the Dell P2415Q proved itself to be a rather capable all-rounder. Before even using the monitor we knew that Dell would have ticked a number of important boxes for some users with the ergonomic flexibility and fairly straightforward design without potentially unwanted fripperies such as touch-sensitive buttons. Very early on in our testing it became apparent that Dell had calibrated the monitor very nicely in the ‘Standard’ mode. It was pretty much spot on the promised 6500K white point and tracked the 2.2 gamma nice and tightly. The colour gamut was generous without being excessive and the colour produced were rich, vibrant and accurately represented. There were no worrisome uniformity issues with our unit either, even without the ‘Uniformity Compensation’ mode enabled. In fact enabling this mode seemed counter-productive – locking the contrast and brightness controls of the monitor whilst making uniformity a little worse if anything.
The contrast performance was much as we were hoping for really. Static contrast was as high as you generally see on IPS panels and the distinction between ‘light’ and ‘dark’ shades, as well as nuances in between, were good. There was the expected ‘IPS glow’, which dampened peripheral detail to a degree, but elsewhere detailing was appropriate. Despite being what would generally be considered a ‘semi-glossy’ screen surface we did find the image a little grainy at times. Not obnoxiously so, but a little surprising on such a light (low haze value), vibrancy-preserving matte screen surface. Another area that was quite solid was responsiveness. Within the confines of the 60Hz refresh rate, which is unavoidable on ‘4K’ monitors currently, the overall responsiveness was as good as you could hope for really. The pixel responsiveness was good enough to drive this refresh rate without any obvious additional trailing, whilst the pixel overdrive implementation left the monitor free from overshoot (inverse ghosting) using the ‘Normal’ setting. Input lag was also pretty much a non-issue. Our testing suggested a fairly low signal delay which even fairly sensitive users should find perfectly fine.
And now onto the all-important resolution. ‘4K’ UHD monitors are quite polarising entities. On the one hand they provide a tremendous number of pixels, bringing potentially incredible detail and real-estate to the desktop, movies and games. We found the overall detail and clarity on games to be excellent although no better than the 28” models we’d tested from a normal viewing position. Even with our noses practically touching the screen we didn’t feel hard done by in the way of pixel density. On the other hand, pushing this many pixels requires a relatively large amount of graphical power. And even if the hardware (GPU and monitor) is fully capable of providing a pleasing ‘4K’ experience, the software may not be up to the task. In this article and indeed this very review we look at some potential scaling issues, lack of support in movies and games not generally taking full advantage of the resolution.
We still got a lot of enjoyment out of the monitor and for our uses, at least, didn’t come across any particularly irksome issues related to scaling or being completely unable to play our favourite games. We are still in the early stages of ‘4K’ monitor technology and things do need some ironing out – but we definitely see light at the end of the tunnel. If you aren’t put off with the potential issues and accept that this is a developing technology that will mature and get better with age, then the P2415Q can be considered like a fine wine. It’s already a good product, but it’s yet to show its true colours.

| Positives | Negatives |
Calibration of our unit in the ‘Standard’ mode was outstanding – gamma and white point was right at the promised targets and colours were vibrant, accurately presented and varied. The generous but not excessive colour gamut and very light matte screen surface helped in this respect as well
| The ‘UHD’ standard calls for a much broader colour space (Rec. 2020) than the ‘sRGB’ that this monitor covers, although that’s technically and logistically a no-go at the moment
|
Pleasing static contrast performance and pleasing uniformity on our unit. Quite in-line with our expectation of a good IPS monitor really
| Despite being light matte, the surface texture of the screen proved a little grainy for our taste. This won’t bother everyone and wasn’t really excessive, however. IPS glow was also an issue, although an expected one |
The monitor performed well within the confines of its 60Hz refresh rate, with well-balanced pixel responsiveness and relatively low input lag
| Some users would prefer a higher refresh rate and perhaps extras such as ‘G-SYNC’ or ‘FreeSync’ for gaming – current UHD and most GPU options will not please those people, however
|
An excellent pixel density produced stunning detail and clarity and games, (some) movies and on the desktop. The amount of useable work space crammed into the 23.8” screen was fantastic
| Application support for the resolution is not where it ideally would be – there are scaling issues, some out of place elements in games and a lack of ‘4K’ movies. Also, it’s very demanding graphically |
As an Amazon Associate I earn from qualifying purchases made using the below link. Where possible, you’ll be redirected to your nearest store. Further information on supporting our work.