Author: Adam Simmons
Date published: August 16th 2017
Table of Contents
Introduction
The 2560 x 1440 resolution has now found its way onto monitors of various sizes. The ‘original’ screen size for this resolution, 27”, is still preferred by many due to its pleasing but not extreme pixel density and a good physical size for most users on their desk. The BenQ EW2770QZ offers a 60Hz 27” IPS-type panel, much like the BL2710PT we reviewed some time ago. This is a newer panel, naturally, and is combined with some new features such as ‘Brightness Intelligence Plus’ (B.I. +) plus a much sleeker design. We take a look at these attributes as well as key performance criteria such as contrast, colour reproduction and responsiveness.
Specifications
This monitor features a 60Hz 27” AHVA (Advanced Hyper Viewing Angle) panel, which is panel manufacturer AU Optronic’s version of IPS (In Plane Switching). This offers true 8-bit colour reproduction (no dithering) alongside a 2560 x 1440 resolution and 60Hz refresh rate. A 5ms grey to grey response time is specified, which as usual you shouldn’t really look too much into. Some key ‘talking points’ of the specification have been highlighted in blue below, for your reading convenience.
Features and aesthetics
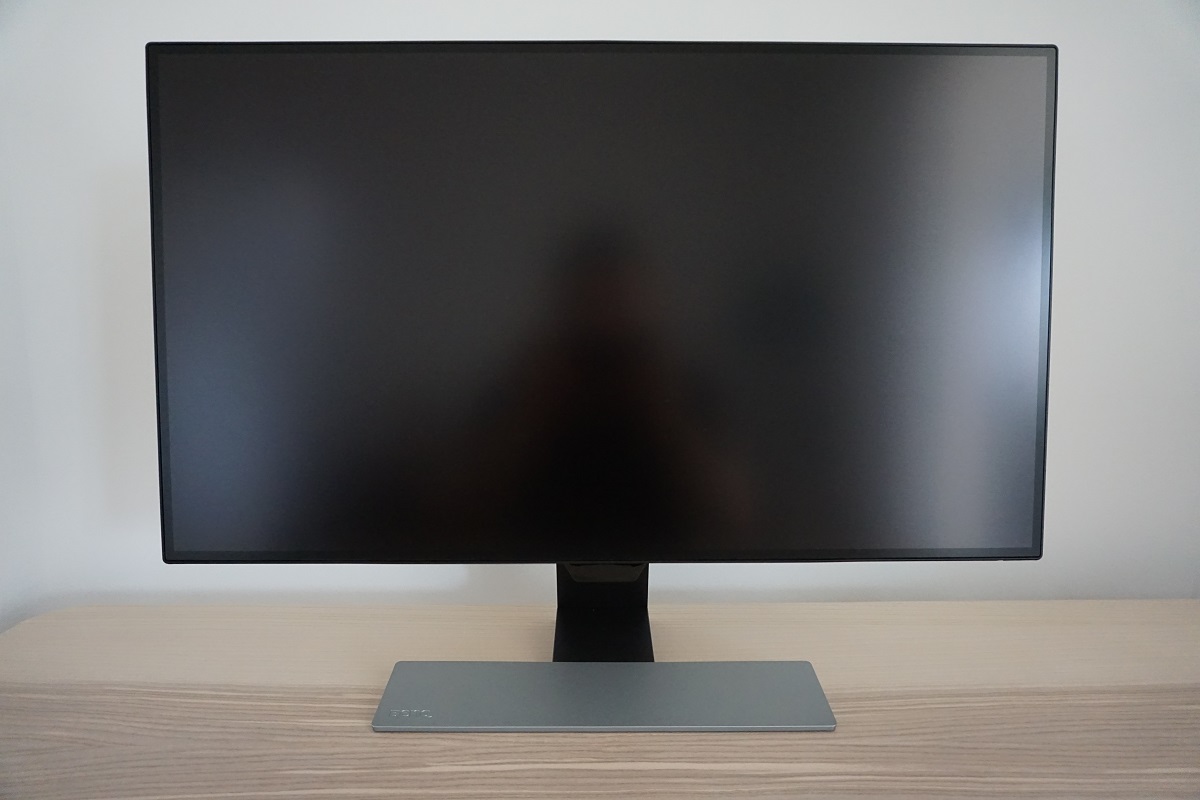
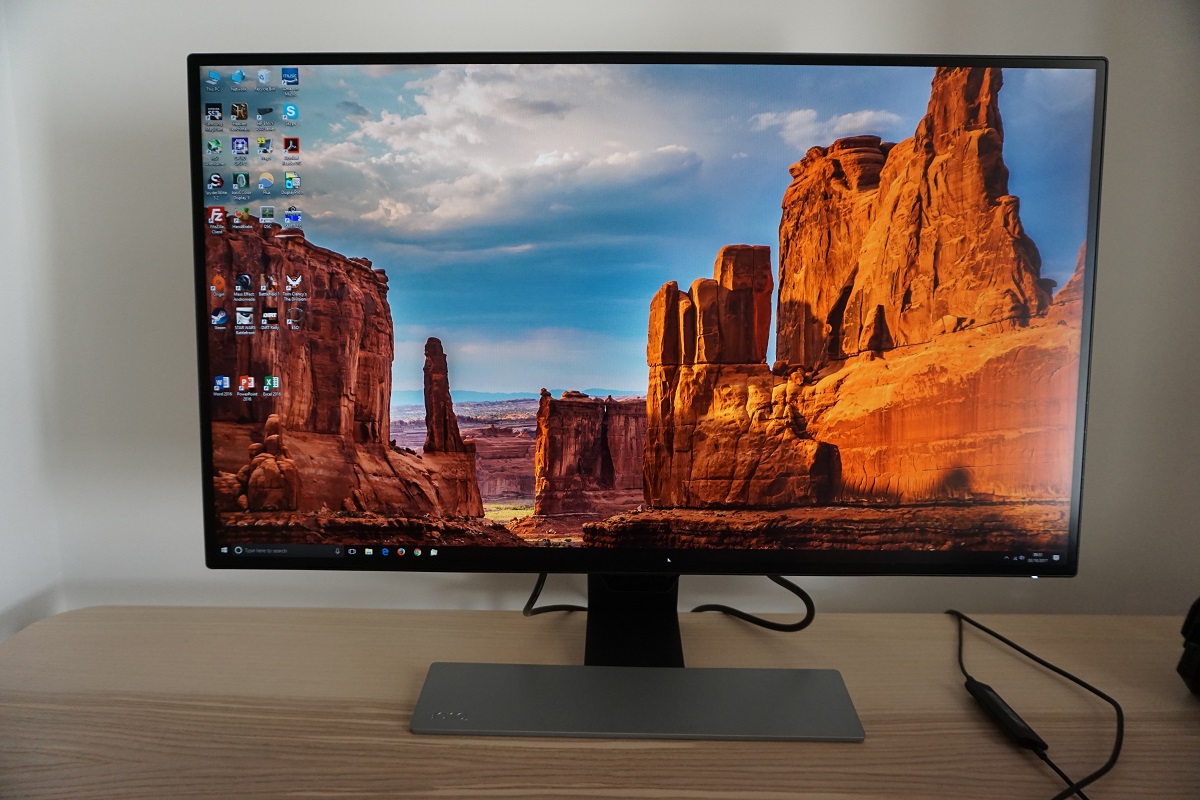
From the front the monitor is sleek and angular. The screen surface is very light matte anti-glare, as explored later, surrounded at all sides by a slim bezel. The bezel is a dual-stage design with a very thin hard black matte plastic outer component and a thin inner panel border. The total thickness of each bezel is ~8.5mm (0.33 inches) at the top and sides and ~9.5mm (0.37 inches) at the bottom. There is also a central box which hangs lower at the bottom; this features the light sensor used for the B.I.+ feature. mentioned in the introduction and explored later.
The OSD (On Screen Display) is controlled by pressable buttons which run vertically down the rear right of the monitor. There is a downwards-facing white rectangular power LED that is visible from the front. It glows white when the monitor is on and dark amber when the monitor enters a low power state (‘standby’) due to signal loss. The functionality of the OSD is explored in the video below.
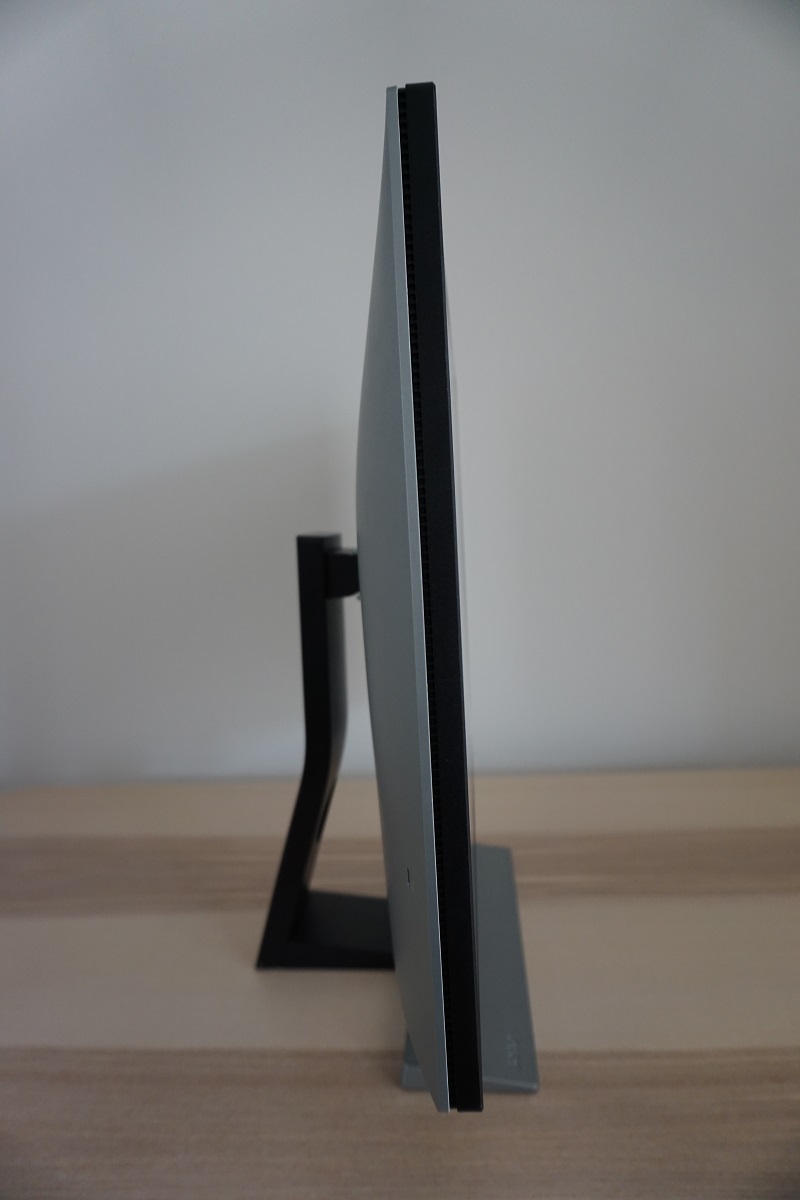
From the side the monitor is fairly slender, ~19mm (0.75 inches) at thinnest point and lumping out centrally towards the stand attachment point. The two-tone combination of semi-matte silver plastic and matte black plastic is also quite visible from this perspective. The included stand offers tilt (5° forwards, 20° backwards) as the only ergonomic flexibility, but VESA mounting is included as explored shortly. The bottom of the monitor (specifically the bottom of the sensor unit in the middle) clears the desk by ~107mm (4.21 inches).
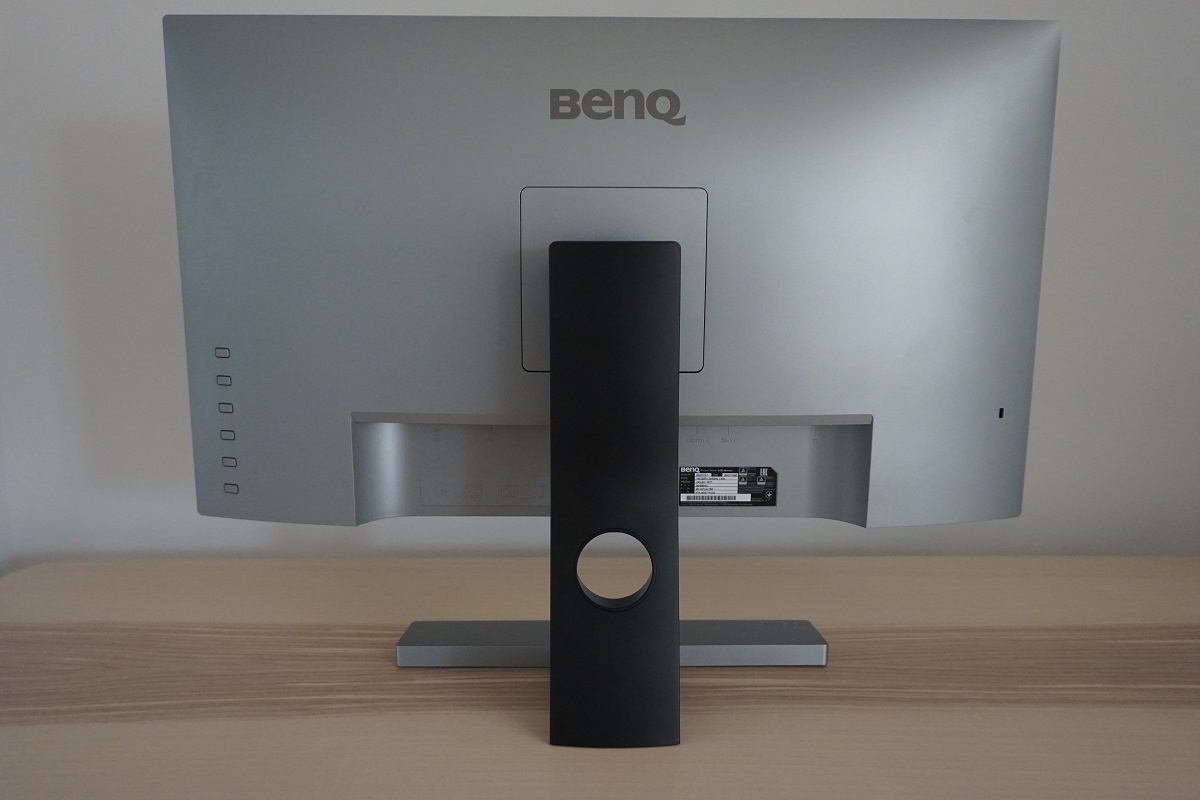
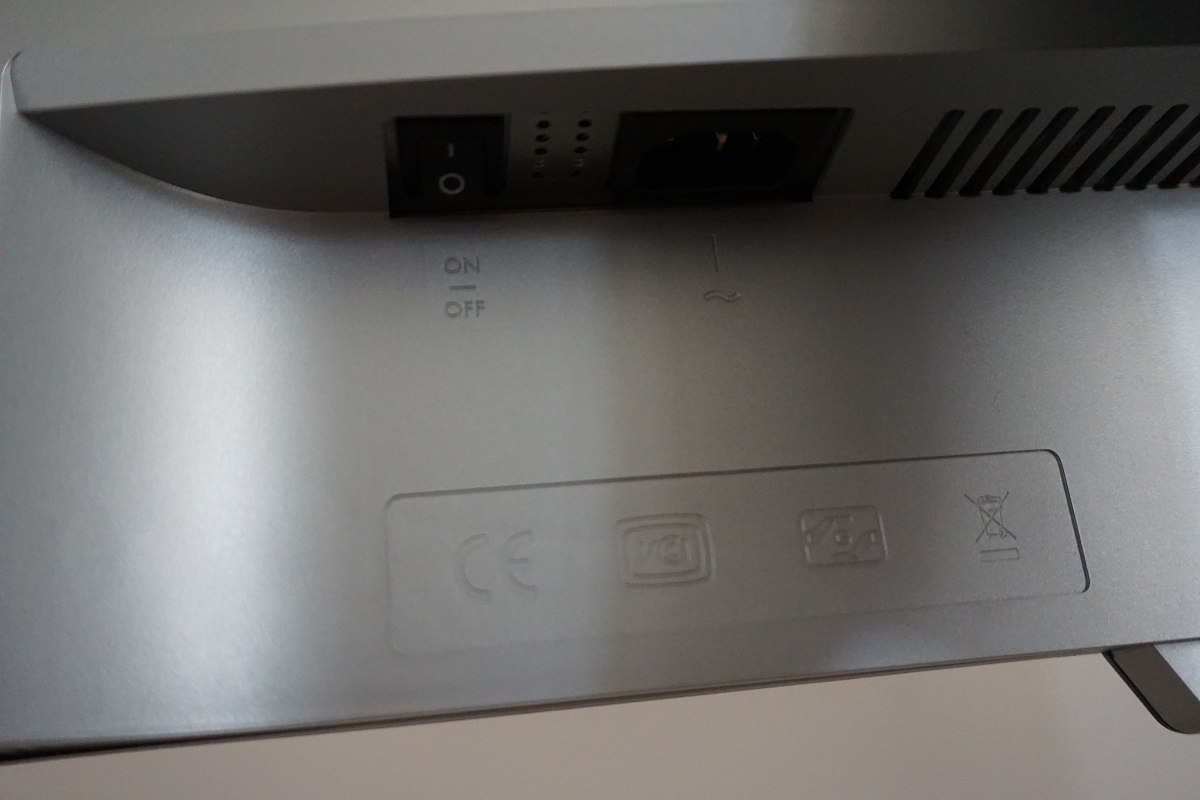
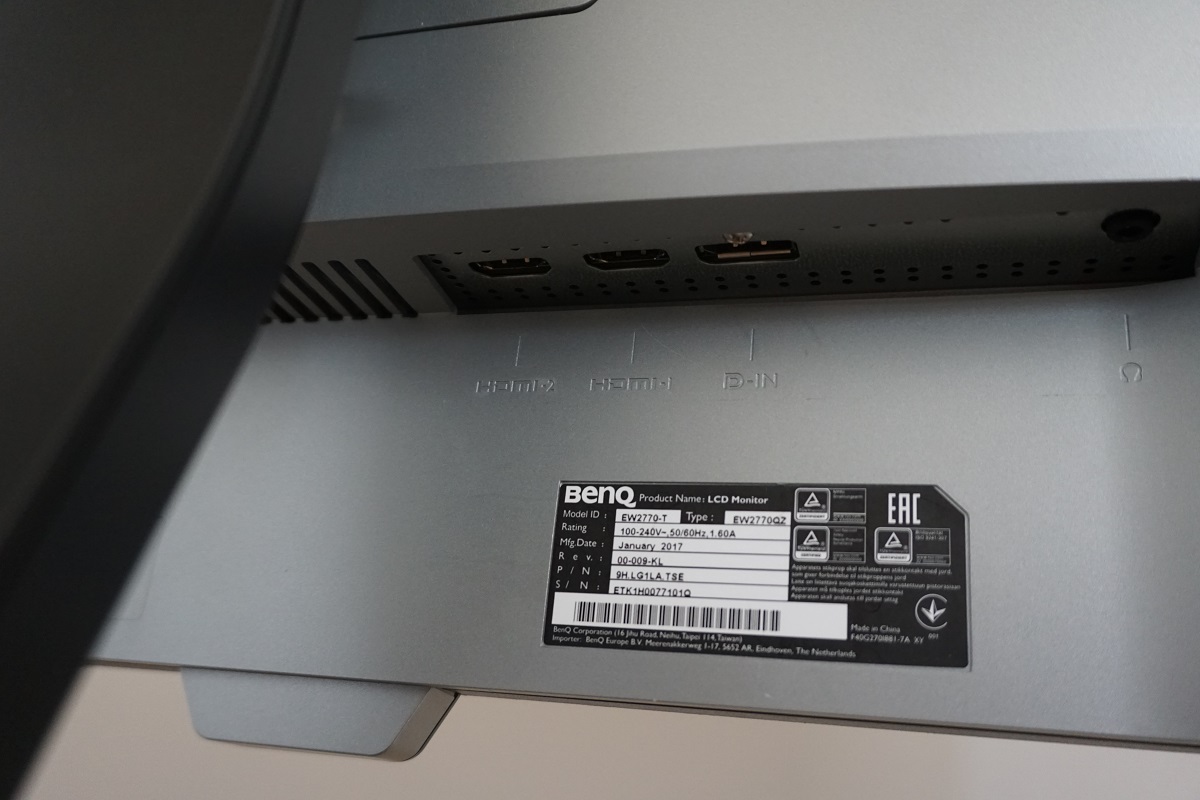
At the rear the monitor is dominated by semi-matte silver plastic. The stand attaches centrally using a quick-release bracket mechanism. Pressing a small silver button beneath the mounting area releases the stand and reveals 100 x 100mm VESA holes for alternative mounting. There is a Kensington Security Slot towards the bottom right. The ports are down-firing, located centrally. To the left of the stand there is a zero-watt power switch and AC power input (internal power converter). To the right there are 2 HDMI 1.4 ports, DP 1.2 and a 3.5mm headphone jack. 2 x 2W speakers are also included for basic but fairly low-quality sound output. Although the speakers had a somewhat ‘hollow’ quality to them due to lack of bass, they offered a decent volume range and would be suitable for basic tasks where standalone speakers or headphones aren’t practical. A power cable and HDMI cable is provided as standard, whilst some retailers and regions may also include a DP cable.
Calibration
Subpixel layout and screen surface
The image below is a macro photograph taken on Notepad with ClearType disabled. The letters ‘PCM’ are typed out to help highlight any potential text rendering issues related to unusual subpixel structure, whilst the white space more clearly shows the actual subpixel layout alongside a rough indication of screen surface. A very light matte anti-glare screen surface is used here, which some users may refer to as ‘semi-glossy’. This provides effective glare handling whilst also preserving vibrancy and clarity a lot better than ‘stronger’ matte screen surfaces. The image is free from obvious graininess, even when viewing very light shades.
![]()
As shown in the image above, the monitor uses the standard RGB (Red, Green and Blue) stripe subpixel layout. This is the default expected by modern operating systems such as Microsoft Windows and Apple MacOS. You needn’t worry about text fringing from non-standard subpixel layouts as a Mac user and don’t need to run ClearType as a Windows user – although you may wish to adjust this according to preferences. You can see that the subpixels appear a bit squat, with relatively large vertical gaps (‘black bands’) above and below the pixels. Given the pixel density and the fact that the subpixels aren’t split into multiple segments, this does not significantly impact text rendering or overall image clarity.
Testing the presets
The BenQ EW2770QZ features various ‘Picture Mode’ presets; ‘Standard’, ‘Low Blue Light’, ‘Cinema’, ‘Game’, ‘Photo’, ‘sRGB’, ‘Rec. 709’, ‘Eco’, ‘M-book’ and ‘User’. There are various other settings that can be manually adjusted, depending on the preset selected, such as ‘Gamma’ and ‘Color Temperature’. Rather than going through every ‘Picture Mode’ and different combination of settings, we’ll focus on some that we find particularly interesting or appealing. The table below shows our general observations alongside key readings (gamma and white point) taken using a Datacolor Spyder5ELITE colorimeter, with the monitor running various settings. The monitor was left in its ‘Plug and Play’ state without additional drivers or ICC profiles specifically loaded and was left to run for over 2 hours prior to readings being taken. It was connected to an Nvidia GTX 1070 using the included HDMI cable, on a system running Windows 10. Similar observations were made when using DisplayPort. Unless otherwise stated, assume default settings were used, with the exception of ‘B.I. +’ being disabled. When viewing the figures in this table, note that for most PC users ‘6500K’ for white point and ‘2.2’ for gamma are good targets to aim for.
Note that everything was correct by default with respect to colour signal, which is to be expected given that this is a 2560 x 1440 (WQHD) display. If you’re using HDMI and wish to check this, please refer to this article on correcting the colour signal. The monitor has an associated setting in ‘Picture Advanced’ called ‘HDMI RGB PC Range’. By default this is set to ‘Auto Detect’ and should work fine, but feel free to select ‘RGB(0 ~255)’ as a PC user, if you want to be sure.
| Preset Mode | Gamma (central average) | White point (kelvins) | Notes |
| Rec. 709 | 2.4 | 6681K | Very dim with good depth to shades, a vibrant look and pleasing shade variety. As per the preset name, this is specifically set up for work within Rec. 709. |
| sRGB | 2.2 | 6709K | Bright and slightly cool-tinted with weaker saturation than other presets. This is an sRGB emulation mode which restricts the colour gamut slightly, as explored later. Image still appears fairly vibrant overall with pleasing shade variety. |
| Standard (Factory Defaults) | 2.2 | 6687K | Bright and vivid with pleasing shade variety. The image has a slightly cool look but is otherwise well-balanced. |
| Gamma = 0 | 2.3 | 6527K | As above but slightly more shade depth in places due to gamma handling. |
| Gamma = 1 | 1.8 | 6650K | As factory defaults with much lower average gamma. Things look ‘washed out’ and flooded as a result of this. |
| Gamma = 2 | 2.0 | 6718K | As above with slightly more depth, but still a lack of depth to many shades. |
| Gamma = 4 | 2.4 | 6623K | Quite similar to ‘Gamma = 0’, with a bit more depth again. |
| Gamma = 5 | 2.6 | 6648K | As above but even more depth – some shades show clear oversaturation or are significantly deeper than intended. |
| Low Blue Light = Multimedia -30% | 2.2 | 6322K | This is the weakest Low Blue Light (LBL) setting. It’s not particularly effective as it is only slightly warmer than the factory defaults – only a minor reduction in the blue colour channel and hence blue light output. |
| Low Blue Light = Web Surfing -50% | 2.2 | 5642K | As above but strong blue light reduction. The image looks significantly warmer than factory defaults, particularly when you first activate this mode you’re your eyes haven’t adjusted. |
| Low Blue Light = Office -60% | 2.2 | 5126K | As above but a further reduction in blue light output and an even warmer appearance. |
| Low Blue Light = Reading-70% | 2.2 | 4802K | The strongest of the LBL settings, giving a significant reduction in blue light output from the monitor. Lowering brightness makes this reduction even more significant (brightness is fully adjustable in all LBL presets). This is desirable in the hours leading up to bed time, as blue light is stimulating and disruptive to sleep. We like using this mode for our own viewing comfort in the evenings (but not for testing, unless specifically stated). |
| User (Color Temperature = User Define) | 2.2 | 7637K | All colour channels are in their neutral position and the image looks very cool indeed – a sort of ‘high blue light’ setting. Good gamma handling is maintained and shade depth and variety is largely appropriate. |
| Test Settings | 2.2 | 6528K | Very nice balance to the image with strong gamma handling retained and a vibrant but accurate and suitably varied look to the image. |
Out of the box the monitor was bright but quite well balanced, with a slight cool tint. Gamma tracking was pleasing, with shades represented in a vivid but accurately represented fashion. A range of ‘Gamma’ modes were available, although for the ‘2.2’ average we and most PC users would target, the default mode was optimal. The graph below shows gamma tracking under our ‘Test Settings’ – this was very similar in that respect to the factory defaults. You can see strong adherence to the desirable ‘2.2’ curve. The monitor also included a range of useful and easy to activate Low Blue Light (LBL) settings, which proved effective in cutting down on blue light emission as intended. These can be assigned to a ‘Custom key’ as demonstrated in the OSD video, too, for even easier access. Although the factory setup for the monitor was decent, we decided to make some tweaks to improve colour balance (and, specifically, adherence to the 6500K white point target). For our ‘Test Settings’ we switched to ‘User’ and made some changes to the colour channels. We also lowered the brightness a fair bit. Any settings not mentioned below, including contrast, were left at default. We have also included the AMA (Advanced Motion Acceleration) pixel overdrive setting used in the review just for reference. Brightness= 50 (according to preferences and lighting) Color Temperature = User Define R= 100 G= 91 B= 90 AMA= High We used a BasICColor SQUID3 (X-Rite i1Display Pro) to measure the luminance of black and white using various settings. From these values, static contrast ratios were calculated. This data is presented in the table below, with blue highlights indicating the results under our ‘Test Settings’. Black highlights indicate the highest white luminance, lowest black luminance and highest contrast ratio recorded. Assume that any settings not mentioned here were left at default, with the exceptions already noted in the calibration section. This includes ‘B.I. +’ being disabled.

Gamma 'Test Settings'
Test Settings
Picture Mode = User
Contrast and brightness
Contrast ratios
Monitor Profile White luminance (cd/m²) Black luminance (cd/m²) Contrast ratio (x:1) 100% brightness 312 0.32 975 80% brightness 255 0.27 944 60% brightness (Factory Defaults) 202 0.21 962 40% brightness 148 0.15 987 20% brightness 92 0.1 920 0% brightness 34 0.04 850 Rec. 709 77 0.08 963 sRGB 310 0.32 969 Gamma = 0 311 0.32 972 Gamma = 1 310 0.32 969 Gamma = 2 309 0.32 966 Gamma = 4 310 0.32 969 Gamma = 5 311 0.32 972 Low Blue Light = Multimedia -30% 182 0.27 674 Low Blue Light = Web Surfing -50% 159 0.25 636 Low Blue Light = Office -60% 134 0.24 558 Low Blue Light = Reading -70% 119 0.23 517 User (Color Temperature = User Define) 359 0.32 1122 Test Settings 170 0.18 944
With only brightness adjusted, the contrast ratio averaged 940:1. This is in-line with our expectations given the panel type and specifications. The peak contrast ratio recorded was 1122:1, with ‘Color Temperature’ set to ‘User Define’ and all colour channels in their neutral position of ‘100’. Following the adjustments made to our ‘Test Settings’ the contrast ratio remained quite good at 944:1. The Low Blue Light settings reduced the contrast ratio a fair bit, with the reduction being more pronounced for the strongest setting (‘Reading’, which yielded 517:1). The maximum luminance recorded on this table was 359 cd/m², with a 34 cd/m² minimum white luminance recorded. This gave a pleasing luminance adjustment range of 325 cd/m².
The monitor has a ‘Dynamic Contrast’ setting that can be activated in the ‘Standard’, ‘Cinema’, ‘Game’ and ‘Photo’ presets. This can be set between ‘1’ and ‘5’, with higher numbers increasing the speed of response to changes in scene brightness. With this setting enabled, the backlight brightness is allowed to dynamically adjust in response to changes in light and dark on the screen. As usual, the backlight is adjusted as a single Backlight Unit (BLU). Even with mixed content displayed we found the screen uncomfortably bright and didn’t find the setting really added anything positive to the experience. We prefer manual control of brightness.
PWM (Pulse Width Modulation)
The BenQ EW2770QZ does not use PWM (Pulse Width Modulation) to regulate backlight brightness at any level. DC (Direct Current) is used to regulate backlight brightness, so the monitor is considered ‘flicker-free’. This will come as welcome news to users who are sensitive to flickering or other side-effects of PWM usage.
Luminance uniformity
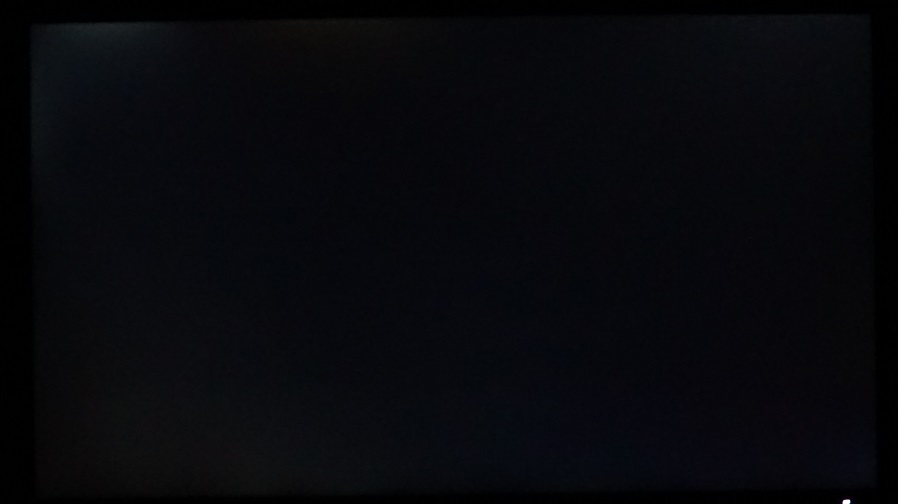
Observing a black screen in a dark room revealed moderate backlight bleed, particularly noticeable towards the top left of the screen where spotlighting can be seen. Note that individual units vary when it comes to backlight bleed. The image below shows the backlight bleed on our unit, taken from a central viewing position a few metres back to eliminate ‘AHVA glow’ (‘IPS glow’). The glow can be observed from a normal viewing position, manifesting itself as a silver or golden sheen that depends on the viewing angle. It is typically most noticeable towards the bottom corners of the screen from a normal viewing position. The sheen appears to ‘bloom out’ from sharper viewing angles – this is demonstrated in the viewing angles video deeper into the review.
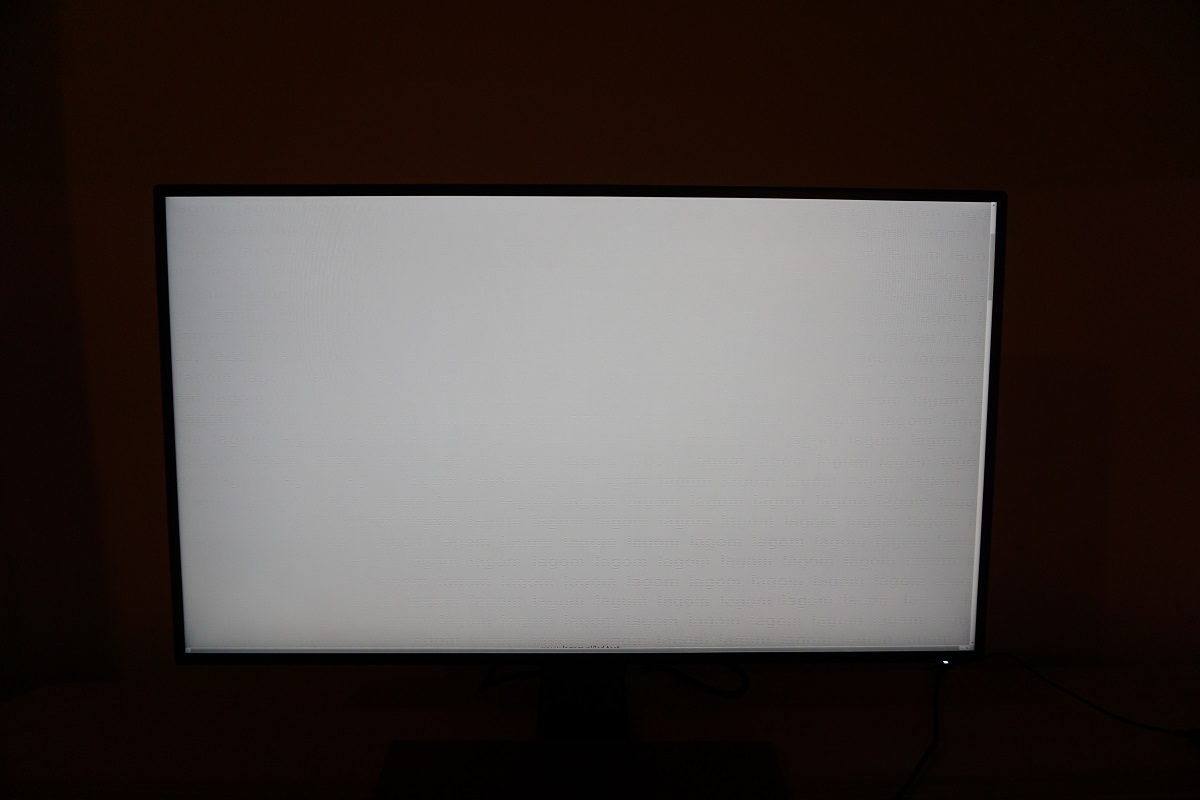
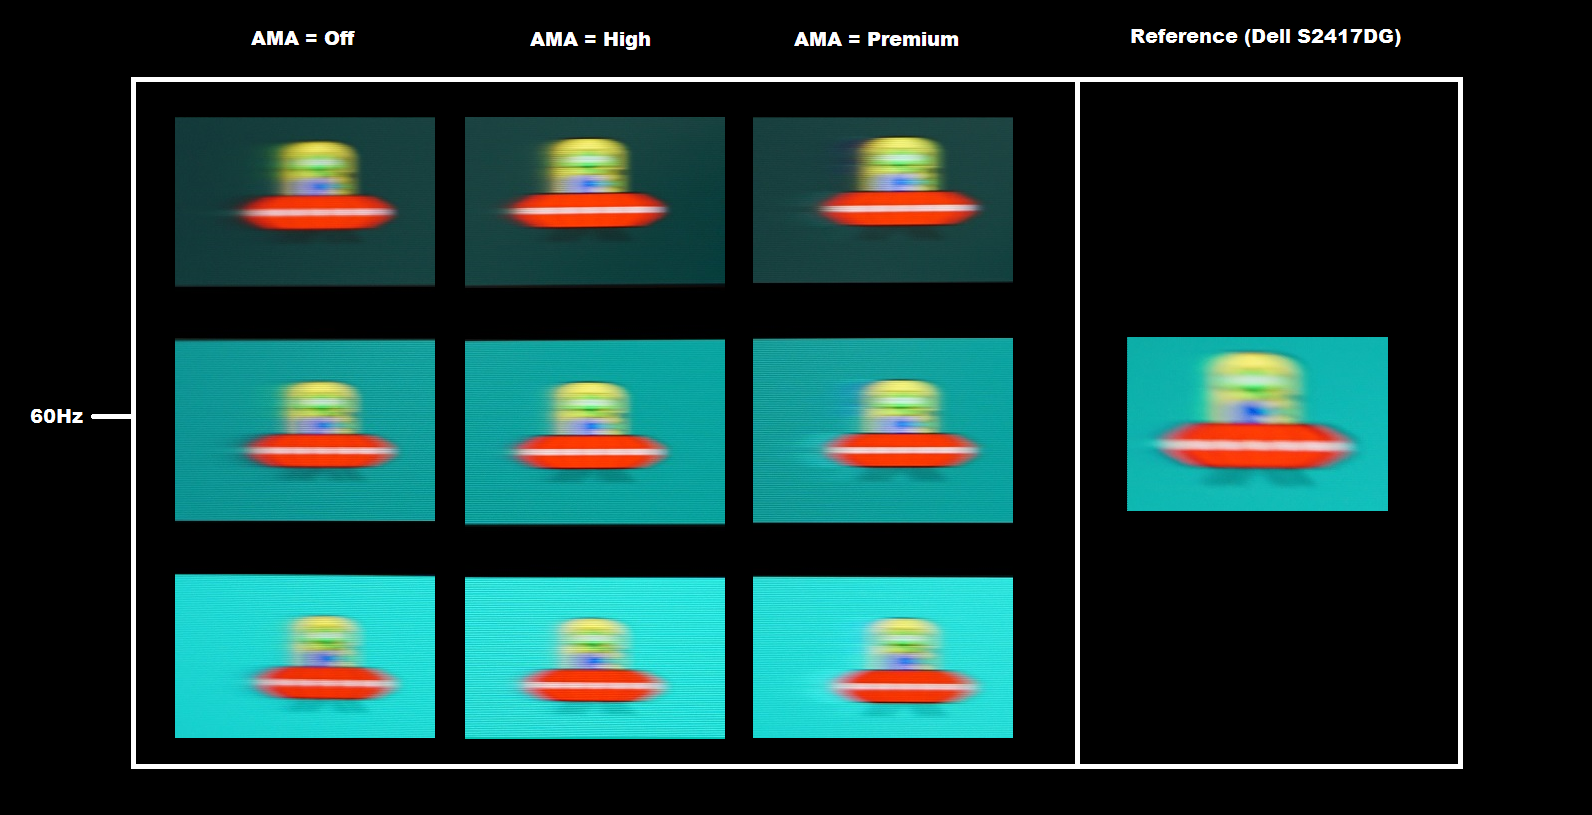
The Spyder5ELITE colorimeter was used to analyse the uniformity of lighter colours, represented by 9 equidistant white quadrants running from the top left to bottom right of the screen. The table below shows the luminance recorded at each quadrant and the deviation between a given quadrant and the brightest quadrant. The luminance uniformity of the screen was excellent. The brightest point recorded was ‘quadrant 5’ in the centre of the screen (158.0 cd/m²). The greatest deviation from this occurred at ‘quadrant 1’ towards the top left (149.0 cd/m², which is 6% dimmer). Elsewhere deviation from the brightest point was 1 – 4%, which is outstanding for a monitor without any sort of specific uniformity compensation feature enabled. Note that individual units vary when it comes to uniformity and there can be further deviation beyond the points measured. Nonetheless, the results here were very pleasing. The contour map below gives a graphical representation of the deviations. Darker greys represent lower luminance and therefore greater deviation from the central point than lighter greys. The colour temperature deviations for the same 9 quadrants were also analysed using the colorimeter. Deviations here are assigned DeltaE values, with higher values representing greater deviation from the D65 (6500K) daylight white point target than lower values. The contour map below shows this, with stronger shades indicating greater deviation from the 6500K target. A DeltaE of >3 here is considered significant deviation that many users would readily notice by eye. The results here were quite good overall, although a significant deviation was detected between the point closest to 6500K (top central region) and the central right region (DeltaE 3.8). As with other aspects of uniformity, note that there can be deviation beyond the points measured. And note that individual units vary in this respect. On Battlefield 1 (BF1) the monitor put in a decent contrast performance, with good distinctions between bright and dark shades. The overall detail levels in dark scenes were appropriate in more central regions of the screen, whereas the bottom corners had some detail lost due to ‘AHVA glow’. These areas looked somewhat hazy without appropriate distinction in subtle details such as cracks in rocks and the ground or interior building materials. The top left corner of the screen looked somewhat flooded due to the backlight bleed on our sample, too. The very light matte screen surface kept brighter shades looking quite smooth, free from obvious graininess. We also observed the contrast performance in Dirt Rally, where the monitor again put in a decent performance. The same ‘trouble areas’ were observed as in BF1, affected primarily by ‘AHVA glow’ and (on our sample) some backlight bleed, affecting detail levels in dark areas. Overall, though, things looked appropriate in that respect. The relatively ungrainy matte screen surface kept lighter shades such as car headlights and areas of bright sky looking quite smooth, noticeably more so than on some matte screen surfaces. To round off our subjective testing of contrast performance, we made observations using the Blu-ray of Star Wars: The Force Awakens. This film has plenty of scenes which crave strong contrast, where bright elements such as light sabers pierce through extreme darkness. Whilst the distinction between these elements was not as pronounced as on some models, particularly those with VA panels, the brighter elements did stand out quite well. The light screen surface helped in this respect as well, giving them a certain ‘purity’ not captured by some matte screen surfaces. The darker areas looked largely appropriate in terms of detail level, with the black bars of the 16:9 letterbox film ‘absorbing’ (i.e. keeping the image clear of) some but not all of the ‘glow’ and backlight bleed. The Lagom tests for contrast allow specific weaknesses in contrast performance to be identified. The following observations were made. The monitor also features a sort of souped-up Dynamic Contrast setting called B.I. + (Brightness Intelligence Plus). This has the same capability as Dynamic Contrast in that it alters backlight brightness according to what’s being displayed on the screen (again, as a single unit). It also adjusts the image based on input from the light sensor, located in the central underhanging box on the bottom bezel. The setting focuses not only on adjusting backlight brightness according to the scene and ambient lighting, but also colour temperature. B.I. + can be activated in various presets, with the selected preset affecting the ‘base’ image. This is essentially tweaked continuously by the B.I. + function. For example, it can be activated with a ‘Low Blue Light’ setting active and this will bias the image towards warmer colour temperatures. As explored in the OSD video, you can also adjust the sensor sensitivity between ‘0’ and ‘100’ in increments of 10. This is designed to give you a small amount of flexibility if you find it is too reactive to relatively slight changes in ambient brightness. We tested the setting extensively, under various ambient lighting conditions and with different things being displayed on the screen. The table below summarises our observations, including; a measurement of white point (taken using the Datacolor Spyder5ELITE), observations on Lagom and general observations. The table includes assessment under our ‘Test Settings’ and with the ‘Reading’ LBL setting activated, offering a useful benchmark for comparison. Observations are also included with B.I. + active and the monitor set to the ‘Standard’ preset as well as set to the ‘Reading’ preset. The ‘Normal’ preset with B.I + was tested in daylight, under fairly bright conditions with natural noon daylight streaming in through windows at both sides of the monitor. We also tested ‘Normal’ with B.I. + and the ‘Reading’ LBL preset with B.I. + in the evening. The room was fairly dim, illuminated by multiple Philips Hue bulbs set to a colour temperature of ~2300K. As shown in the table above, the B.I. + feature did make its promised adjustments. But we didn’t find these adjustments to be anything approaching optimal. In our daylight viewing conditions, using the ‘Normal’ preset with B.I. +, the colour temperature was actually very similar to what it was in our evening testing conditions. To our eyes the lighting environment was clearly different, yet both the measured white point and the overall image failed to adequately reflect this. Flooding the room with light from the Philips Hue lighting at ~6500K only yielded ~ 5400K as the measured white point. And the image generally appeared too warm regardless of the content being displayed. It was possible to measure a white point of 6604K by shining an LED camera flash from a Samsung Galaxy S7 directly at the sensor from fairly close range. Changing the sensor sensitivity didn’t significantly affect these findings, either. It wasn’t just colour temperature we found disagreeable, it was also the brightness adjustments made. The image was generally uncomfortably bright during the daytime and although it dimmed slightly where mixed content was displayed with plenty of dark elements, it still remained fairly bright. The dark elements generally looked flooded, whilst mixed content with lighter content really ramped things up so they appeared simply too bright and ‘in your face’. Whilst gaming, watching movies or flicking between various content on the internet we also found the constant brightness adjustments annoying. Much like ‘Dynamic Contrast’, of course. In the evening the image was frequently too dim for our liking – especially but not exclusively using the ‘Reading’ mode in conjunction with B.I. + Overall, it felt like B.I. + tries to do too much at the same time and simply lacks the flexibility it needs to be a particularly useful feature. Our eyes are quite adept at compensating for changes in ambient lighting or the image that they’re seeing, particularly given enough time. Equally, they are quite sensitive to the frequent changes that occur with B.I. + enabled as the content on the screen changes. We would prefer to see a de-coupling of the light sensor from the ‘Dynamic Contrast’ aspects, as well as greater control over its operation. For example, we’d like to be able to set boundaries for maximum and minimum brightness. Given the importance of cutting out blue light in the hours leading up towards bed, it would also be useful if the monitor had some capacity to adjust its colour temperature based on time of day and not just the light striking the sensor directly. Which it seems relatively ineffective at properly compensating for. An integrated clock wouldn’t go amiss in that respect, like a sort of monitor-based f.lux that could be combined with a flexible light sensor based solution for optimal effect. That would certainly be preferable to the additional ‘Adjust by duration’ feature we discuss in the OSD feature, that adjusts colour temperature based on how long the monitor has been switched on rather than the actual time of time. The EW2770QZ’s colour gamut (red triangle) was compared to the sRGB reference colour space (green triangle), as shown below. The first image shows the colour gamut using our ‘Test Settings’, which uses the ‘User’ preset. Here you can see comprehensive sRGB colour space coverage (100%) with a little bit of extension beyond this, particularly in the green corner of this gamut representation. The second image shows the colour gamut using the ‘sRGB’ preset. This is an sRGB emulation mode that cuts back on the gamut a bit (99% sRGB with very little over-extension). This trades the slightly more vibrant look using the native gamut of the monitor for potentially more accurate representation of some shades, within the sRGB colour space. On Battlefield 1 (BF1) the monitor provided a rich but accurate palette of colours, with pleasing natural variety. There was a pleasing array of subtly different green shades, for example, displayed with excellent consistency. Earthy browns appeared appropriately rich without unwanted red bias and rocky greys appeared quite neutral and as intended. There were some flashes of vibrancy in the right places, too, for example lashings of orange, yellow and red for flames and some brightly coloured fauna. The red poppies being particularly striking. Overall shades were displayed with a touch of extra vibrancy, thanks to the colour gamut, but this was not excessive and did not provide any garish oversaturation or makes shades look out of place. Dirt Rally was also presented in a pleasing way in terms of colour reproduction. A rich palette of greens and browns ensured the racing environments were faithfully reproduced, looking believable and in some cases quite attractive. The monitor was also able to output a wealth of vibrant neon and bright colours, for example for car liveries and advertising around the tracks. Unlike on traditional untamed wide gamut displays, the extra saturation levels served to simply add a bit of extra vibrancy rather than add intense and obvious oversaturation. Yellows, oranges and reds appeared distinct without crossing over into each other (yellows did not tend to look inappropriately orange and oranges did not appear inappropriately red). Our final subjective test for colour reproduction is a rather unforgiving one; the Blu-ray of Futurama: Into the Wild Green Yonder. There are large areas of individual shade, highlighting weaknesses in colour consistency readily. The monitor performed strongly in this respect, as you’d expect from a decent IPS-type display. The distinction between subtly different pastel shades and the distinction of a given shade at different points of the screen was very good. The representation of bright neon shades such as bright greens as well as eye-catching deep shades such as purples was also pleasing. This combination of strong consistency and decent vibrancy helped give this movie the sort of look it craved. Lagom’s tests for viewing angle tests were used to further explore colour consistency and viewing angle performance. The following observations were made from a normal viewing position, eyes around 70cm from the screen. On some monitors faint interlace patterns can be seen during certain transitions, particularly noticeable where light shades (muzzle flashes, explosions etc.) briefly pop up on the screen. These are sometimes referred to as ‘inversions artifacts’. Alternatively, static interlace patterns can be seen with some shades appearing as faint horizontal bands of a slightly lighter and slightly darker version of the intended shade. We did not observe any such artifacts on this monitor. A utility called SMTT 2.0 was used alongside a sensitive camera to compare the latency of the EW2770QZ with various monitors of known input lag. We took over 30 repeat readings to maximise accuracy. Using this method, we measured 3.85ms (under 1/4 of a frame) of input lag. This value is influenced both by the element of input lag that you see (pixel responsiveness) and that which you feel (signal delay). It indicates a very low signal delay that even sensitive users shouldn’t find problematic. In our responsiveness article we explore the factors which influence monitor responsiveness. One of the key concepts explored is ‘perceived blur’, which is contributed by both the pixel responses of the monitor but also the movement of our eyes motion is followed on the screen. It’s actually this second factor that predominates on modern monitors. We also explore a technique called ‘pursuit photography’, which uses a moving rather than stationary camera to capture motion in a way that reflects both pixel responsiveness and eye (camera) movement. The images below are pursuit photographs taken using the UFO Motion Test for ghosting, with the test running at the default speed of 960 pixels per second. This is a practical speed for such photography and a good speed to highlight the key elements of perceived blur. The UFO moves across the screen from left to right at a frame rate matching the refresh rate of the display. All background shade levels (dark, medium and light) were used and all three ‘AMA’ (‘Advanced Motion Acceleration’) settings on the monitor were tested. The final image shows a 60Hz reference monitor, namely a Dell S2417DG. This monitor offers rapid pixel responses without significant weaknesses, providing a good idea of what to expect in this test where pixel responses aren’t really a limiting factor. You can see that, in all cases, the UFO body appears quite soft and unfocused. This reflects a moderate degree of perceived blur related to eye movement and linked to the 60Hz refresh rate of the display. Varying degrees of trailing behind (i.e. to the left of) the UFO can be seen as well, which is down to weaknesses in pixel responsiveness. With ‘AMA’ set to ‘Off’, you can see a fair amount of trailing behind the UFO for all backgrounds tested here. Setting this to ‘High’ offers a significant improvement, cutting down the trailing nicely. There is still a small amount of ‘powdery’ trail behind the object. This is most pronounced but still fairly faint for the dark background and to an extent the medium background – the lighter background, meanwhile, doesn’t have noticeable trailing behind it. The ‘Premium’ setting replaces this trailing with more noticeable inverse ghosting (overshoot). This is caused by excessive grey to grey acceleration, giving an obvious bright trailing behind the object for all backgrounds. From this assessment, it’s clear that ‘High’ is the optimal setting to use. Note that we will not be including a section on ‘overclocking’ in this review as the monitor skipped frames when set above 60Hz. On Battlefield 1 (BF1) there was a fair amount of perceived blur, caused mainly attributable to eye movement and therefore largely as you’d see on even the fastest 60Hz LCDs. For the most part pixel responses were rapid enough to deliver an experience free of noticeable trailing beyond that. There was a little bit of additional trailing in places, though, which increased perceived blur by giving an additional ‘powdery trail’ behind some objects. This was most pronounced (but still not particularly bothersome) for transitions involving fairly bright shades. Moving past a rock or tree trunk with bright clouds behind, for example, produced a little bit of trailing that added to perceived blur. There was no obvious overshoot, either, although there was a small amount here and there. It generally manifested itself as a sort of ‘snail slime’ trail of a slightly more transparent variant of the shades involved in the transition. This blended in quite readily and certainly didn’t jump out at us as bright or ‘shadowy’ overshoot might. We made similar observations on Dirt Rally, where it was eye movement that was the predominant cause of perceived blur on the monitor. There were again some weaknesses beyond this, but nothing major. When racing at night some of the more ‘troublesome’ transitions were introduced, where you could see a bit of extra trailing behind bright lights set against a darker background. This was still the more minor component of perceived blur and if users found this bothersome they would undoubtedly find any 60Hz LCD too limiting. There was no obvious overshoot, again just a trace here and there that we had to specifically look out for to really notice. These slight weaknesses in pixel responsiveness were too slight to come into play when watching our Blu-ray test titles. These are limited in their fluidity by the ~24fps frame rate at which they run, and they were presented much as they are on the fastest 60Hz LCDs in terms of motion performance. Not everyone has the GPU power capable to run all of their games or applications at 2560 x 1440 (WQHD), or they may be using a games console or other device that is limited to a lower resolution. Such users may want to run the monitor at 1920 x 1080 (Full HD or ‘1080p’) instead. The monitor performs an interpolation process when it is set to run at a non-native resolution such as this. To ensure the monitor is handling this, rather than inferior GPU scaling being used, you’ll need to make a quick trip to the graphics driver to make sure everything is set up appropriately. For AMD GPU users this is automatically handled by the monitor when gaming, by default. Nvidia users should open the Nvidia Control Panel and navigate to ‘Display – Adjust desktop size and position’. They should ensure that ‘No Scaling’ is selected and ‘Perform scaling on:’ is set to ‘Display’ as shown below. The interpolation process provided a somewhat softer look to the image when compared to a native Full HD model of similar size. However; the image retained superior sharpness and detail levels to many monitor interpolation processes we’ve seen. The monitor is certainly usable at 1920 x 1080 without the image looking completely odd or as if everything has been placed under some extreme soft-focus filter. There are imperfections, as with any interpolation process of this type, but these are less pronounced than on quite a few models we’ve tested. If you’re sitting back a bit and using the monitor for console gaming at Full HD, for example, you’re not likely to find these imperfections too bothersome. You also gain a bit of flexibility in terms of sharpness control on the monitor, although we found the default level of ‘5’ optimal. Adjusting this simply made the image look odd rather than making it look more detailed or closer to a native Full HD image. There is also a ‘Super Resolution’ feature than can be set to 3 different intensity levels. Even at a level of ‘1’, the lowest with the feature enabled, things simply looked odd and as if a weird Photoshop filter was applied. As usual, if you keep the monitor at 2560 x 1440 and are viewing lower resolution content (such as a movie), then it is the GPU or movie software that handles the scaling rather than the monitor. This gives a slight softening when compared to running the content on a native Full HD display, although this is not something most users should find bothersome. For those looking for strong all-round performance and a pleasing but not extreme pixel density, 27” WQHD (2560 x 1440) models remain popular choices. The BenQ EW2770QZ offers this resolution and combines it with a 60Hz AHVA (IPS-type) panel. The monitor itself has a sleek homely design, but has a stand that is limited to tilt as the only ergonomic flexibility. This is quite different to the solid fully-adjustable stands offered on some BenQ models, for example their ‘PD’ and ‘BL’ series. The screen does at least include 100 x 100mm VESA holes for alternative mounting, if the stand ergonomics are an issue. One of the key new features of the monitor is B.I. + (Brightness Intelligence Plus). We found this worked in as much as the monitor reacted to changes in ambient lighting and content on the screen. The adjustments made didn’t really tally with what we’d consider optimal in most cases, though, and we didn’t find the setting of any practical benefit. The hardware itself (light sensor) certainly works and is nothing new to BenQ monitors, but they’ve yet to make proper use out of it by offering the sort of flexibility it needs in the real world. Namely, the ability to set upper and lower limits for brightness – couple that with a clock on the monitor that allows colour temperature to adjust according to time of day and you’d have a very tidy solution. The contrast was largely as we were expecting given the panel type and specifications, with just under ~1000:1 static contrast measured (a bit of variability depending on settings) and the usual ‘AHVA glow’ eating away at some peripheral detail. We don’t usually like to talk too extensively about uniformity, as it varies between individual units of the same model, but we were quite impressed by the luminance uniformity of our unit when displaying white. Less so with black (there was quite a bit of backlight bleed), but you can’t win all the battles. The monitor provided rich, varied and accurately represented colours straight from the box with generous sRGB coverage and an effective sRGB emulation mode that cut back on the gamut a little. Reducing brightness is all some users would feel the need to do – the flexibility is also there to adjust gamma and colour channels in the OSD, according to uses and preferences. As usual we found BenQ’s Low Blue Light (LBL) settings to be well implemented and easy to activate, too. We were also pleased with the choice of screen surface (very light matte anti-glare), as this provided a relatively clean and ungrainy look to the image. You could have the best calibrated monitor in the world with superb colour reproduction and amazing contrast, but if the screen surface provides a smeary or grainy look to the image it simply mars the result. In terms of responsiveness, it’s clear from the 60Hz refresh rate that this was never intended to appease hardcore gamers. Nonetheless, it ticked a lot of boxes for those who are happy with the limitations of the 60Hz refresh rate. There was very little input lag, which is far from a given on 60Hz WQHD monitors. The pixel responsiveness was also quite well tuned, with most of the perceived blur being attributable to eye movement rather than pixel responsiveness. There was no obvious overshoot and only minor additional trailing in places. Overall, then, it’s fair to see this model ticks a lot of boxes when it comes to ‘core performance’. It’s a capable all-rounder, but it doesn’t offer the ergonomic flexibility or solid stand build quality of some competing products. It would also be disappointing for those expecting great things from the B.I. + feature. And we still feel there is so much wasted potential with what is clearly a sensitive and capable light sensor integrated fairly neatly into the monitor. A bit of flexibility on the software side (OSD) would go a long way to making this sensor more useful in the real world. The bottom line; strong core performance and decent aesthetics on one hand, limited ergonomic flexibility and a fairly uninspiring ‘headline feature’ (B.I. +) on the other.

Luminance uniformity table

Colour temperature uniformity map

Colour temperature uniformity map
Contrast in games and movies
Lagom contrast tests
B.I. + (Brightness Intelligence Plus)
Monitor profile Measured white point (kelvins) Lagom contrast gradients Lagom black level Lagom white saturation General observations ‘Test Settings’ 6522K All blocks showed distinct brightness steps, with good saturation levels. All blocks show distinct brightness steps, although the first few blend into the background well. They’re not really visible in a fairly well-lit room. This is normal for a monitor that adheres closely to the ‘2.2’ gamma curve, however. All but the final checkerboard pattern distinct from background. Good balance to image with pleasing shade variety and rich but accurate shade representation. The brightness level is comfortable across a good range of ambient lighting environments. Low Blue Light = Reading 4800K All brightness steps distinct, red blocks appear rather ‘fiery’ (strongly saturated). All blocks visible, first two blend in quite readily and not distinguishable from background in a moderately bright room. Final pattern blends into background readily, other patterns distinct from background. The image appears warm, more so initially but the eyes adjust to an extent. We find this relaxing for extended use in the evenings. Brightness is comfortable and can be manually adjusted according to preferences and lighting. Standard with B.I. + (daylight) 5108K Darkest blocks difficult to distinguish, due primarily to lighting conditions. Good brightness steps elsewhere. First few blocks blend in readily with remainder of first row quite faint due primarily to bright room. The remaining blocks showed good brightness steps, but a noticeable warm tint to mid-tones. All but final checkerboard pattern visible against background. Obvious warm tint overall and excessive brightness when displaying predominantly lighter content. Excessive saturation and shade depth in places, too. Where plenty of bright shades were displayed on the screen, darker shades looked flooded in places – not just due to the fairly high ambient lighting in the room but also excessive backlight brightness from the monitor. Standard with B.I. + (evening) 5128K Distinct brightness steps in most cases. Strong saturation to red bar with the uppermost 3 bars blending together. 2 final purple bars also blend together. All but first visible against background. The second block is just about visible but not really ‘distinct’. There are distinct steps up in brightness elsewhere. All but final checkerboard pattern distinctly visible against background. Final pattern faintly visible. Warm look to the image overall, although not compared to Low Blue Light setting (i.e. higher colour temperature than we’d like in the evening). Image quite dim overall, too dim for our liking where plenty of darker shades are displayed. The image appears quite vibrant on the whole, despite low brightness – with some obvious oversaturation in places. Low Blue Light = Reading with B.I. + (evening) 3875K All brightness steps distinct. Colours look noticeably muted. Distinct brightness steps in all cases, although first block is not particularly distinct from background. All but final checkerboard pattern distinct from background, although second-last pattern not as distinct as it should be. Image appears very warm overall and is generally comfortable to look at, although too dim for our liking – especially when predominantly darker content is displayed. Colours appear dull and the overall image ‘flooded’ for the most part.
Colour reproduction
Colour gamut

Colour gamut 'Test Settings'

Colour gamut 'sRGB'
Colour in games and movies
Viewing angles
The following video shows the Lagom text test, a mixed desktop background and dark desktop background from various viewing angles. As you’d hope from an IPS-type panel, the image maintains a good level of contrast and its colour characteristics even from reasonably steep angles. Also note the ‘AHVA glow’ that appears to bloom out from steeper viewing angles in particular, as highlighted in the final section of the video.
Interlace pattern artifacts
Responsiveness
Input lag
Perceived blur (pursuit photography)
Responsiveness in games and movies
Interpolation and upscaling

Conclusion
Positives Negatives Strong colour performance straight from the box with pleasing sRGB coverage (plus a good ‘sRGB emulation mode’), delivering a rich, varied and accurately represented image
No wide gamut support or HDR capability
Decent static contrast and a pleasingly ungrainy look to the image thanks to the very light matte anti-glare screen surface ‘AHVA glow’ eats away at some peripheral detail, static contrast strongest where the monitor is in its neutral state – with an unpractically high (cool-tinted) colour temperature Well-tuned pixel overdrive and very low input lag, delivering a pretty solid 60Hz performance
The 60Hz refresh rate may limit the appeal to some users – plus some minor weaknesses in pixel responsiveness in places
A good practical resolution and pixel density for many users, decent interpolation performance and quite a simple but stylish design
Lacks the ergonomic flexibility or solid stand design of some competing products, whilst B.I.+ seems a waste of a perfectly good light sensor
![]()