Author: Adam Simmons
Date published: January 10th 2019
Table of Contents
Introduction
27” 2560 x 1440 models with high refresh rate hit the sweet spot for many users in terms of image quality and responsiveness. There are three very different panel ‘flavours’ that now cover this ‘niche’, each with distinct strengths and weaknesses. The AOC AG273QCG of the AGON 3 series comes in potentially the fastest flavour (TN), adding the interesting addition of a curve to the screen and the (to some users essential) addition of G-SYNC capability. We put this monitor through its paces to see how it fairs in our usual testing regime, which includes quantitative and qualitative testing on a range of applications.
Specifications
The monitor employs a 27” AU Optronics TN (Twisted Nematic) panel with support for a 165Hz refresh rate and true 8-bit colour (without dithering). A 1ms grey to grey response time is specified. Some of the key ‘talking points’ for this monitor have been highlighted in blue below, for your reading convenience.
Key talking points of the specifications are highlighted in blue below.
Features and aesthetics
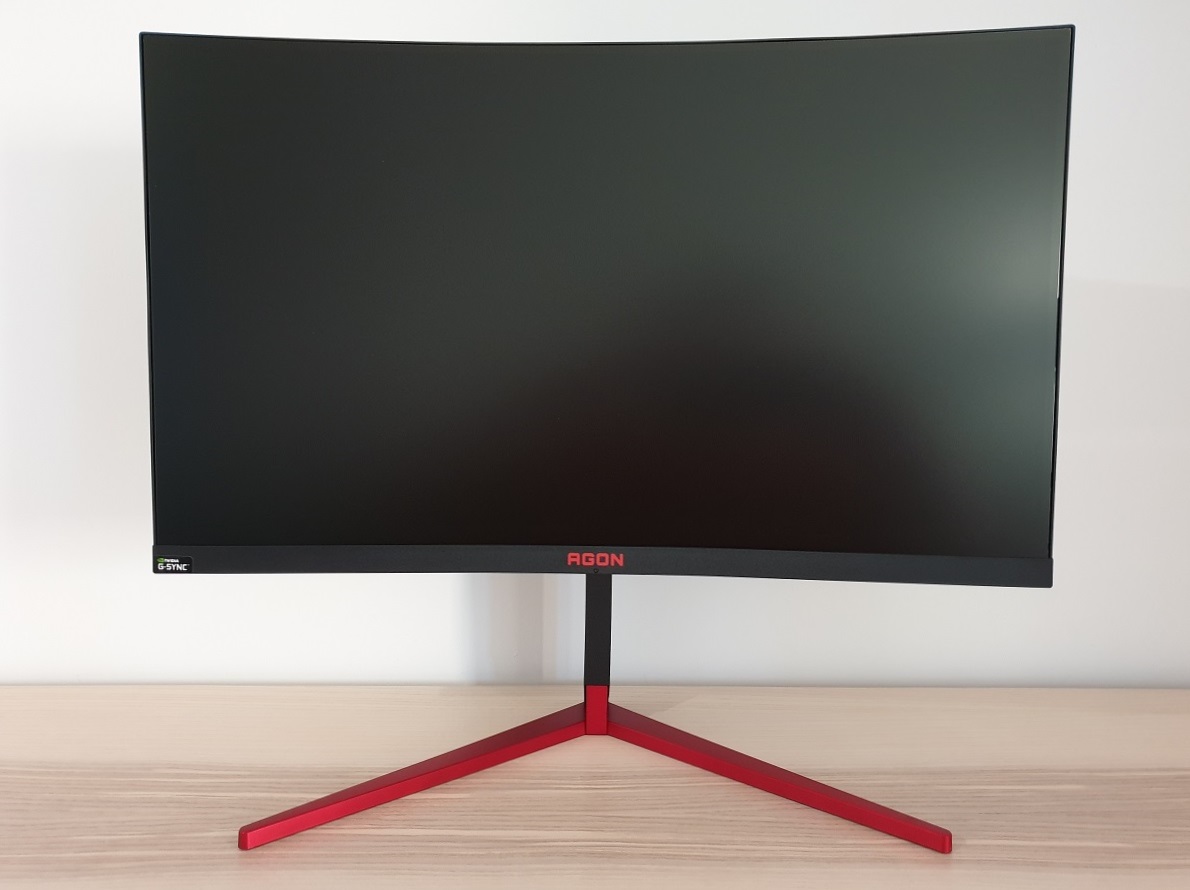
The monitor has a sleek and modern look, with some touches of colour that are more subtle than some gaming monitors. The bezels are very thin, using the now popular dual-stage design with slim panel border surrounding the image and a very slender hard outer component. The panel border blends in nicely when the monitor is off. Including both components, the bezels are ~8.5mm (0.33 inches). The bottom bezel is noticeably thicker and hides pretty much all of the panel border in that region, composed of matte black plastic – at ~23mm (0.91 inches). The stand has a slim low-profile penguin-foot design, taking up minimal depth on the desk but offering the requires level of stability. The neck is matte black plastic whilst the feet are a dark red satin (semi-matte) plastic. Dark red is also used for the central AGON logo on the bottom bezel, which is printed on. The screen itself has a 1800R curve and employs a medium matte anti-glare surface, with both features explored later.
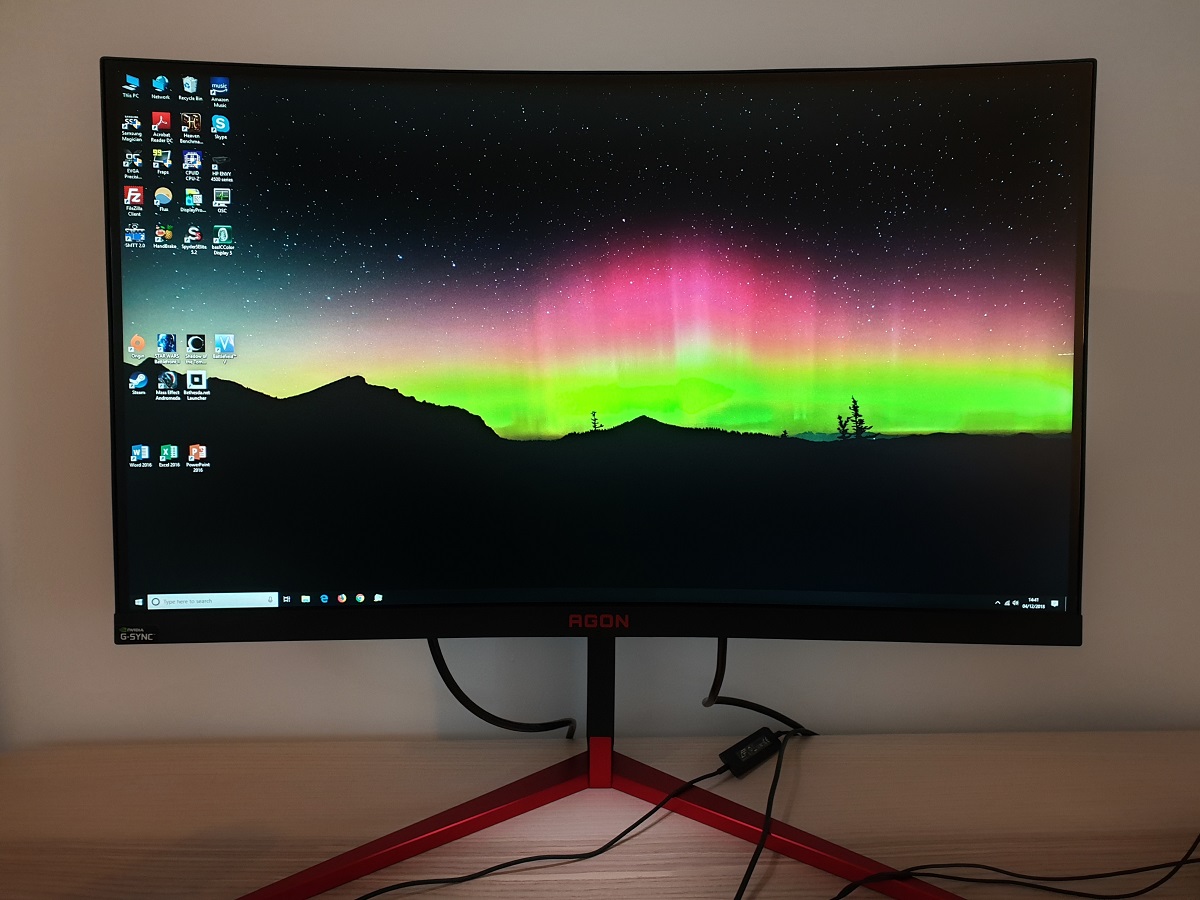
The OSD (On Screen Display) is controlled by a central joystick on the underside of the bottom bezel. The power LEDs are integrated into the ‘Light FX’ (also referred to as ‘AGON Game Lights’) feature, which includes 2 RGB LED patches around the joystick and a ring of RGB LEDs at the rear of the monitor. By default, the power LED glows red when the monitor is on but otherwise follows the settings for ‘Light FX’ in the OSD. Regardless of ‘Light FX’ settings, the power LED glows amber when the monitor enters a low power state (e.g. signal to the system is lost). The video below runs through the OSD and also demonstrates the ‘Light FX’ lighting feature.
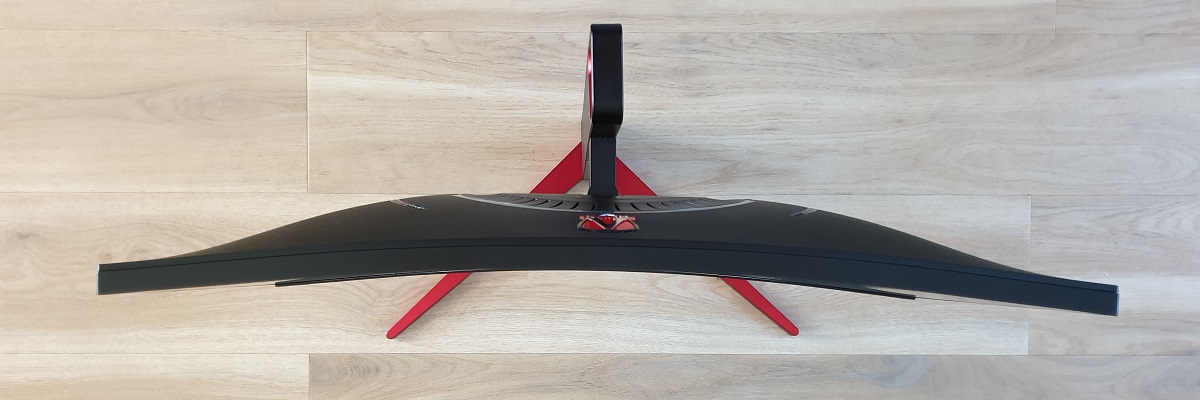
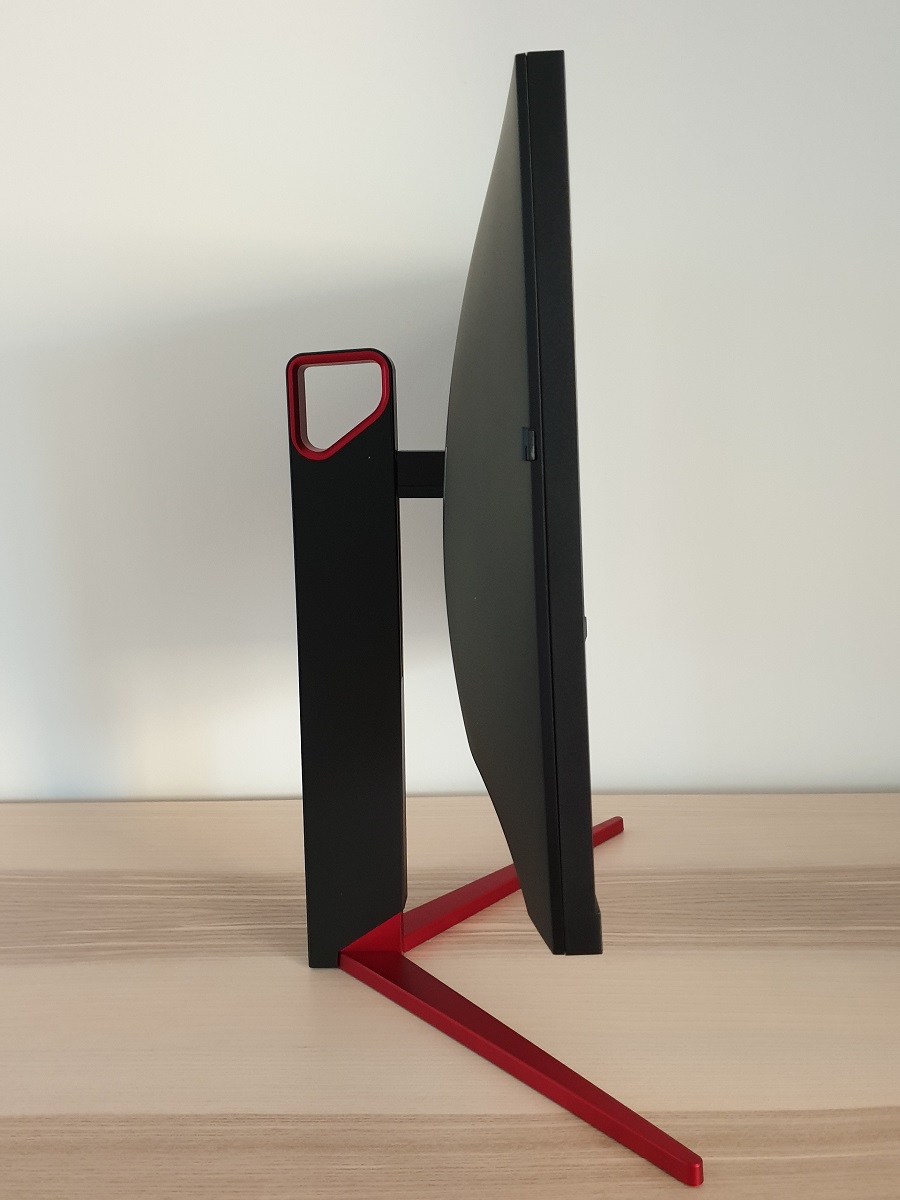
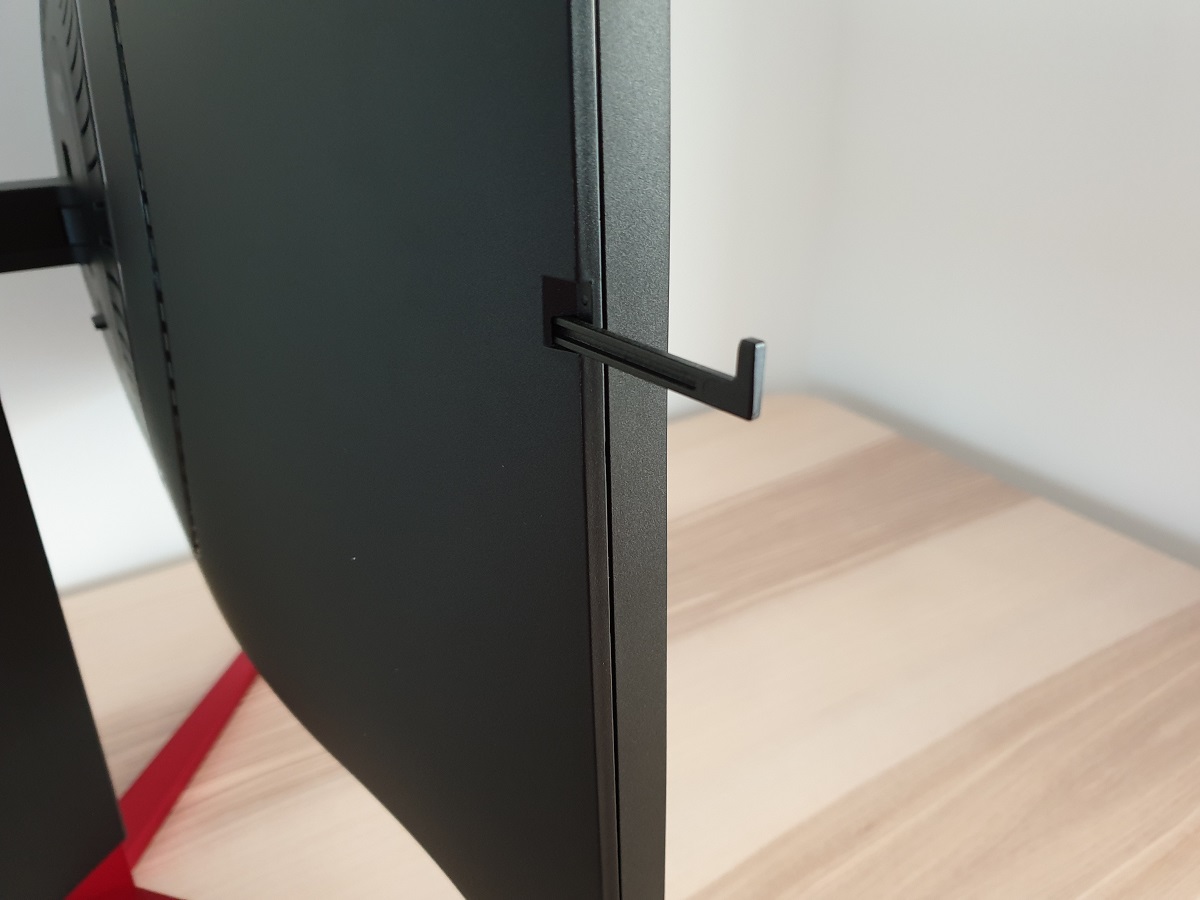
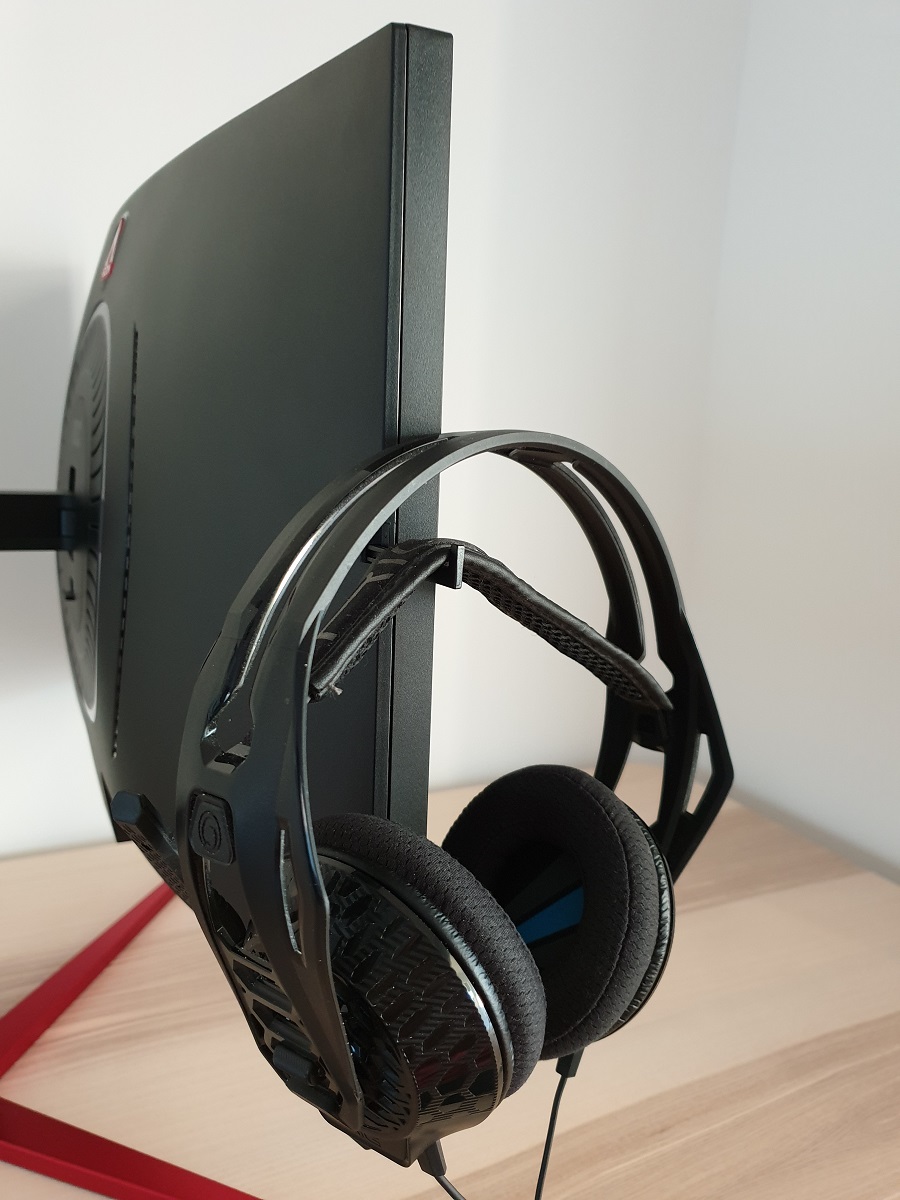
From the side the screen is reasonably svelte, ~18.5mm (0.73 inches) at thinnest point, lumping out centrally towards the stand attachment point. At both sides of the monitor there is a retractable black plastic headphone hook – great for multi-headphone gamers! Or simply the flexibility to choose which side you hang your cans. The monitor stand has a slim neck, but it offers good ergonomic flexibility; tilt, swivel and height adjustment (~5 inches or 127mm). At lowest height, the screen clears the desk surface ~64mm (2.52 inches) with the top of the screen ~430mm (16.93 inches). The total depth of the monitor and stand is ~240mm (9.45 inches), so it’s less of a desk space hog than some models.
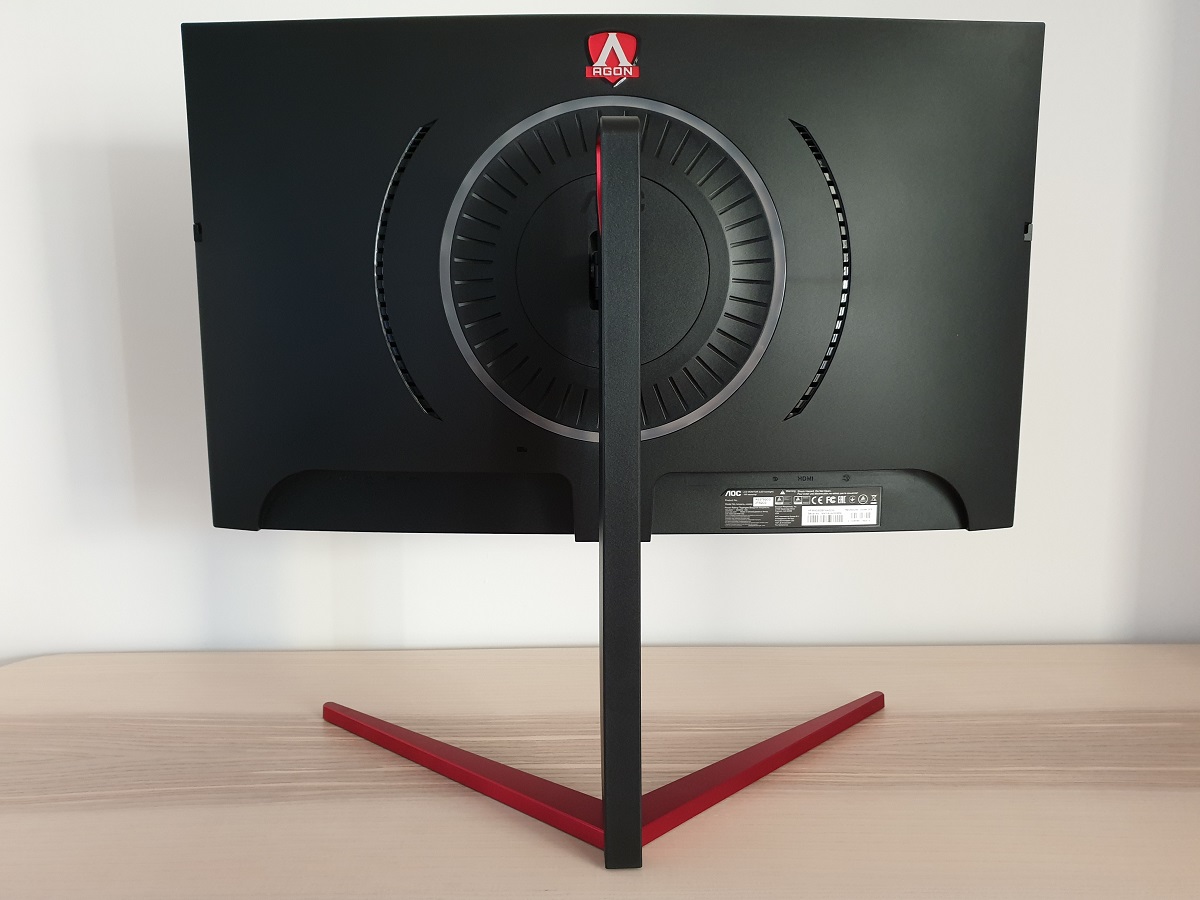
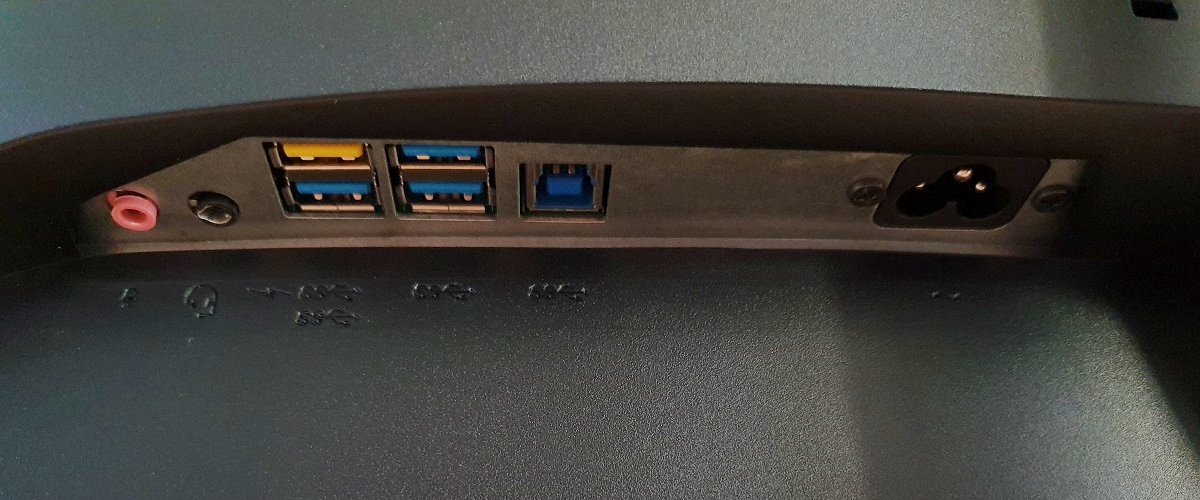
The rear of the monitor is mainly matte black plastic. The AGON logo at the top adds some subtle hints of other colour. Potentially less subtle (but fully controllable, as per the OSD video) is the ring of LED lights (‘AGON Game Lights’) running around the stand attachment point. The included stand attaches centrally using a quick release mechanism and can be detached to make way for an alternative 75 x 75mm VESA solution, if preferred. The ports are down-firing and include, from left to right; 3.5mm microphone jack, 3.5mm headphone jack, 4 USB 3.0 ports (1 with fast-charging, plus upstream), AC power input (internal power converter), DP 1.2, HDMI 1.4 and a 3.5mm audio input. The monitor also includes 2 x 2W integrated speakers, which support DTS Sound and offer quite rich sound output for integrated monitor speakers. They’re not the most bass-rich but offer quite a crisp sound with a fuller quality than most monitor speakers. Especially at this wattage.
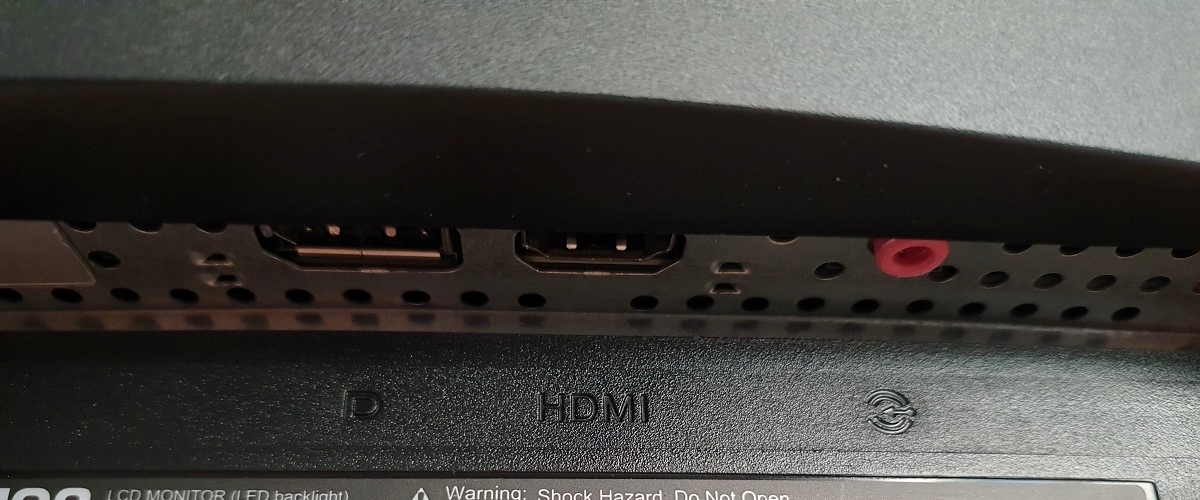
The full capability of the monitor including the 165Hz refresh rate and G-SYNC capability can be leveraged on compatible systems via DP 1.2. The HDMI 1.4 port is there for compatibility with devices such as games consoles and is limited to 60Hz at the native resolution.
Calibration
Subpixel layout and screen surface
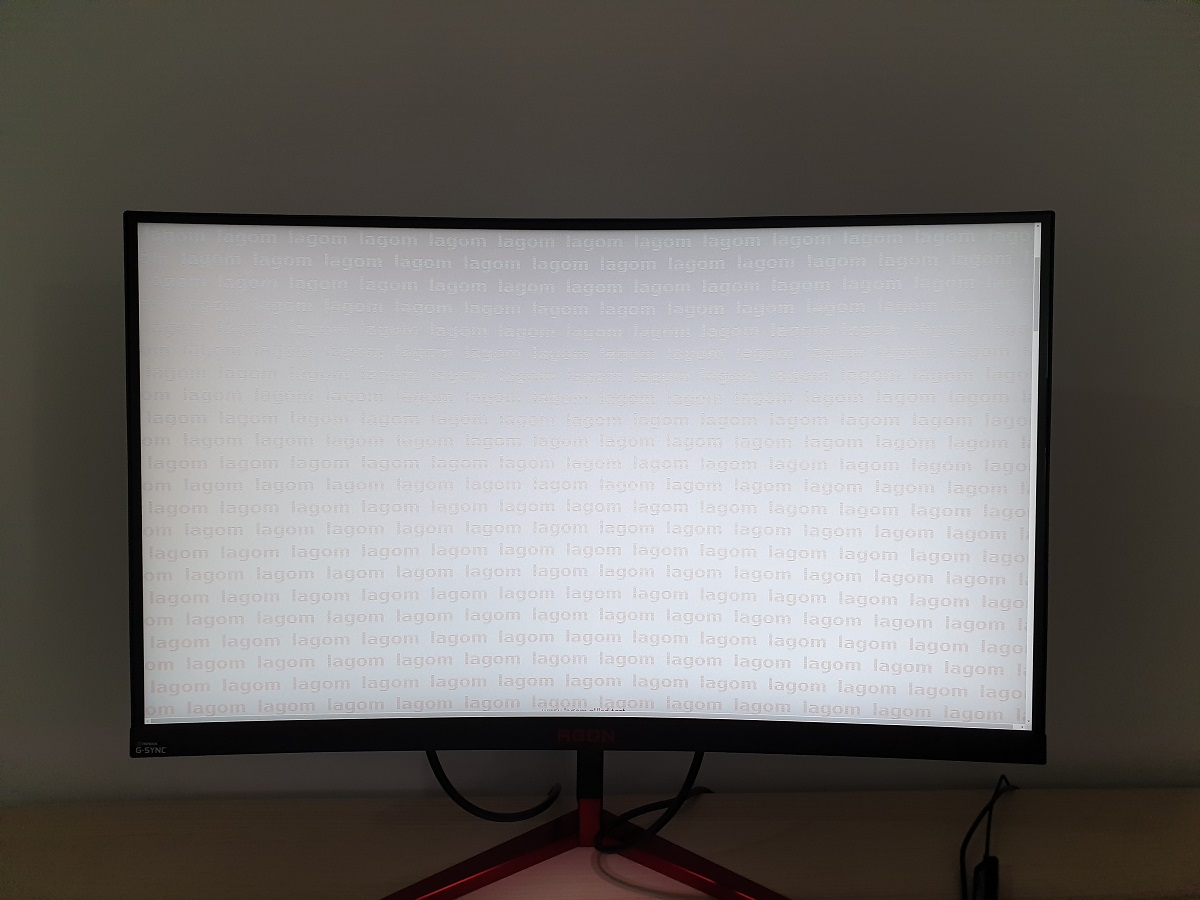
The images below are macro photographs taken on Notepad with ClearType disabled. The letters ‘PCM’ are typed out to help highlight any potential text rendering issues related to unusual subpixel structure, whilst the white space more clearly shows the actual subpixel layout alongside a rough indication of screen surface. This model uses a medium (‘regular’) matte anti-glare screen surface with a rough texture. This handles glare effectively but also diffuses light emitted from the monitor fairly strongly, imparting quite a bit of graininess to the image when observing lighter shades. There was a course and sandy texture to such shades. This is something we found rather noticeable on this model, although we’re quite sensitive to screen surface texture and it isn’t something that everyone would find bothersome. It’s largely comparable to the screen surface used on most other 27” 2560 x 1440 TN models, the exception being newer Dell models and all but the oldest revisions of the S2716DG. A smoother and lighter matte screen surface such as that would have been preferable.
![]()
As shown above, the monitor uses the usual RGB (Red, Green and Blue) stripe subpixel layout. This is the typical layout expected by modern operating systems such as Microsoft Windows and Apple MacOS. You needn’t worry about text fringing from non-standard subpixel layouts as a Mac user and don’t need to run ClearType as a Windows user – although you may wish to run through the ClearType wizard and adjust according to preferences. The subpixel layout and arrangement is quite normal and we had no subpixel-related concerns related to sharpness or text clarity on this model.
Testing the presets
The monitor includes various ‘Game Mode’ image presets; ‘FPS’, ‘RTS’, ‘Racing’ and 3 numbered ‘Gamer’ presets. These settings adjust the OSD settings to various values and in the case of the first 3 also lock off various settings. The numbered ‘Gamer’ presets allow the user to retain full control of the OSD settings. This is briefly touched upon in the OSD video. The presets make various changes but do not achieve anything you can’t achieve by manual adjustment. Because of this, we won’t be specifically testing these and will instead focus on various manual adjustments in the OSD. The table below shows key readings take using a Datacolor Spyder5ELITE colorimeter, such as gamma and white point, alongside general observations. Our test system runs Windows 10 and has an Nvidia GTX 1080 Ti which was connected using the supplied DisplayPort cable. No additional monitor drivers or ICC profiles were specifically loaded. The monitor was left to run for over 2 hours before readings were taken or observations made. Aside from our ‘Test Settings’ where various adjustments are made, assume factory defaults are used. The exception to this was the refresh rate, which was set to 165Hz in Windows following setting ‘OverClock Enable’ to ‘On’ in the ‘Gsync Setting’ section of the OSD. This did not significantly affect the values or observations in this table, however. When viewing the figures in this table, note that for most PC users ‘6500K’ for white point and ‘2.2’ for gamma are good targets to aim for.
| Monitor Settings | Gamma (central average) | White point (kelvins) | Notes |
| Gamma1 (Factory Defaults) | 2.2 | 6011K | Bright with a warm tint, but quite a rich and natural appearance overall. Appropriate central gamma tracking helps lift this above the ‘washed out’ look accompanying models with poor gamma calibration (quite a few high refresh rate TN models). As typical for TN technology, perceived gamma is higher further up the screen and lower further down the screen. This means depth and saturation is excessive higher up the screen and too low lower down the screen. These perceived gamma shifts are not as pronounced as on your typical 24” Full HD 144Hz model, however, and about as low as you’ll see from a TN model. |
| Gamma2 | 2.0 | 6005K | As above but average gamma reduced, giving a washed out appearance in places, particularly lower down the screen where perceived gamma is reduced. |
| Gamma3 | 2.4 | 5998K | As ‘Gamma1’ but higher central gamma. Things look quite striking in places, overall depth and saturation is too high. This is very noticeable towards the top of the screen as viewed from a normal viewing position, due to perceived gamma shifts. Some users will like this striking look, however. |
| LowBlue Mode = Reading | 2.2 | 4649K | A very effective ‘Low Blue Light’ (LBL) setting, significantly reducing the strength of the blue channel. The image appears significantly warmer and has a bit of a green tint – particularly towards the top of the screen (viewing angle related). The blue colour channel is reduced significantly, although default brightness is high and should be reduced to maximise this effect. |
| LowBlue Mode = Office | 2.2 | 4940K | Somewhat weaker effect than above, but still highly effective particularly when combined with reduced brightness. The image appears warm and the green tint is more mild, making it easier for your eyes to compensate for this over time. |
| LowBlue Mode = Internet | 2.2 | 5206K | A reasonably effective LBL setting, weaker than above but still reducing the blue channel significantly compared to factory defaults. Reduced brightness again advised. |
| LowBlue Mode = Multimedia | 2.2 | 5733K | The weakest LBL setting. Only a mild effect, some users might like this for a slight blue light reduction during regular daytime viewing. |
| Test Settings (see below) | 2.2 | 6526K | Similar to factory defaults but a better balance due to significantly reduced brightness and colour channel changes. Gamma tracking remains strong, with the image appearing quite rich and natural overall. Certainly better than what can be achieved on some models with OSD tweaking alone. |
Out of the box the monitor was bright with a somewhat warm tint, but was otherwise well-balanced. Gamma tracking was very close to our preferred ‘2.2’ target as recorded centrally by the colorimeter. It was clear that this was the case by eye, as the monitor didn’t have that dreaded ‘washed out’ look that some high refresh rate models with ‘gamma issues’ are known for. The overall image appeared quite rich and natural. Following the adjustments made to our ‘Test Settings’, the gamma tracking still adhered closely to the ‘2.2’ curve as shown below. Given the intended uses of the monitor, inter-unit variation and pleasing performance following OSD tweaking alone we will not be providing any ICC profiles for this model or using them in the review. Some things to be aware of with how the monitor stores and recalls settings. If you make changes to the settings with ‘Game Mode’ set to ‘Off’, your settings are not recalled if you switch to a different preset then back to ‘Off’. Everything (including brightness) is returned to the factory defaults – customisations to colour channels (RGB) are saved but the monitor will revert to the default ‘Warm’ setting until you change it back. If you use one of the numbered ‘Gamer’ presets you get just as much control with the OSD settings and no negative consequences, plus your settings will be stored correctly. Any changes made in the ‘Color Setup’ menu are stored universally, including any colour channel changes made under the ‘User’ preset. This means that you can’t apply different colour channel settings to different ‘Game Mode’ presets or apply different ‘LowBlue Mode’ settings to different presets. This restriction was slightly inconvenient for us as it’s easier to switch between ‘Game Mode’ settings (joystick left when not in menu) than to activate or deactivate a ‘LowBlue Mode’ setting. Having said that, the ‘LowBlue Mode’ settings are fairly easy to access and they did work effectively to cut down on blue light emission from the monitor. Particularly the two stronger settings (‘Reading’ and ‘Office’) when brightness was also decreased – an important additional step, as the default brightness is rather high. This is important to ensure that you aren’t exposed to too much stimulating blue light in the hours leading up towards bed as it is disruptive to your sleep hormones. Some users like to use these settings at other times, perhaps finding it more relaxing on the eyes. We mainly used the ‘Office’ setting for our own viewing comfort in the evening, with significantly reduced brightness. We didn’t use this for any of our testing beyond that specifically involving the setting, however. Note: We experienced a bug on our unit where it would occasionally set the colour channels to R = 0, G = 0, B = 50 when first turning the monitor on. Thereby giving an extreme cool-cast to the image. The monitor correctly recalled our preferred preset including correct colour channel adjustments once we reselected it, however. For our ‘Test Settings’ we lowered the brightness and made some adjustments to the colour channels. We also changed ‘Game Mode’ to ‘Gamer 1’, although ‘Gamer 2’ and ‘Gamer 3’ could be used all the same. The reasons for this are covered in the previous paragraph, but it basically ensured our ‘Test Settings’ were stored correctly and could be easily recalled during testing. We also used the integrated overclock feature of the monitor and set the refresh rate to 165Hz. Finally, we’ve included our preferred ‘Response Time’ setting, just for reference. Assume any setting not mentioned, including ‘Contrast’ and ‘Gamma’, was left at default. Brightness= 35 (according to preferences and lighting) Color Temp. = User Red= 44 Green= 44 Blue= 50 Overdrive= Medium OverClock Enable= On Refresh rate= 165Hz (Windows setting) A BasICColor SQUID 3 (X-Rite i1Display Pro) was used to measure the luminance of white and black using a range of monitor settings, including those analysed in the calibration section. From these values, static contrast ratios were calculated. Results are show in the table below. Blue highlights indicate the results under our ‘Test Settings’, whilst black highlights indicate the highest white luminance, lowest black luminance and highest contrast ratio recorded (ULMB deactivated). Note that ULMB was tested here at ‘100’ brightness (default is ‘90’), with the highest and lowest available Pulse Width (PW) settings. Assume any setting not mentioned was left at default, with the exceptions already noted here or in the calibration section.

Gamma 'Test Settings'
Test Settings
Game Mode= Gamer 1
Contrast and brightness
Contrast ratios
Monitor Settings White luminance (cd/m²) Black luminance (cd/m²) Contrast ratio (x:1) 100% brightness 427 0.51 837 80% brightness 354 0.43 823 60% brightness 288 0.35 823 40% brightness 219 0.27 811 20% brightness 100 0.12 833 0% brightness 59 0.07 843 Gamma1 (90% brightness, Factory Defaults) 385 0.47 819 Gamma2 386 0.47 821 Gamma3 385 0.47 819 Low Blue Mode = Reading 374 0.47 796 Low Blue Mode = Office 378 0.46 822 Low Blue Mode = Internet 381 0.46 828 Low Blue Mode = Multimedia 382 0.46 830 ULMB @ 85Hz (PW = 100) 426 0.59 722 ULMB @ 85Hz (PW = 10) 45 0.06 750 ULMB @ 100Hz (PW = 100) 339 0.46 737 ULMB @ 100Hz (PW = 10) 35 0.05 700 ULMB @ 120Hz (PW = 100) 308 0.42 733 ULMB @ 120Hz (PW = 10) 32 0.04 800 Test Settings 176 0.23 765
The average static contrast with only brightness adjusted was 826:1, which is reasonable although not overly impressive for this panel type. Note that refresh rate did not impact this value. Following the adjustments made to our ‘Test Settings’, static contrast dropped slightly to 765:1. A reasonable static contrast was maintained using even the strongest ‘Low Blue Mode’ setting. It is specifically reducing the green colour channel (as per ‘Test Settings’) that starts to impact contrast. The highest white luminance recorded was 427 cd/m², whilst the lowest white luminance was 59 cd/m². This gave a luminance adjustment range of 368 cd/m² without loss of contrast, with quite a bright maximum and a reasonably dim minimum.
Contrast dipped slightly with ULMB active, but it remained reasonable. More importantly, you get an excellent luminance adjustment range by just altering the Pulse Width (PW) setting for ULMB. Lower refresh rates have a slight increase in brightness due to the on period of the strobe cycle being longer than at higher refresh rates and the same PW setting. But even at 120Hz and PW = 100, the luminance of 308 cd/m² would be far brighter than the vast majority of users would like to use. PW can be set anywhere between ‘10’ and ‘100’ in single unit increments and you can also decrease the brightness setting itself if you wish, so you’ve got excellent flexibility in that respect.
PWM (Pulse Width Modulation)
This monitor does not use PWM (Pulse Width Modulation) at any brightness level. Instead, DC (Direct Current) modulation is used to dim the backlight at all brightness levels. The backlight is therefore considered ‘flicker-free’, which will be welcomed by users who are sensitive to flickering or worried about the side-effects of PWM usage.
Luminance uniformity
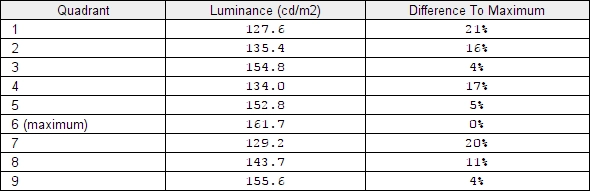
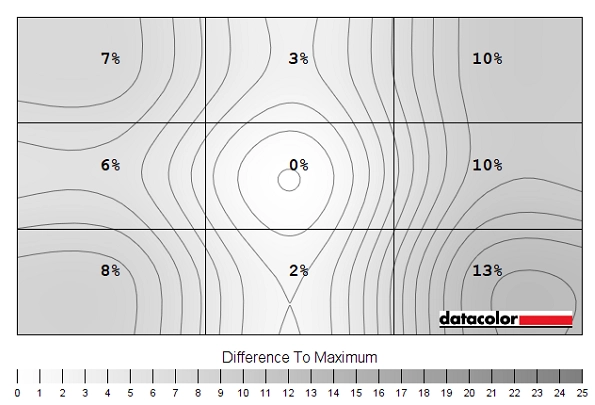
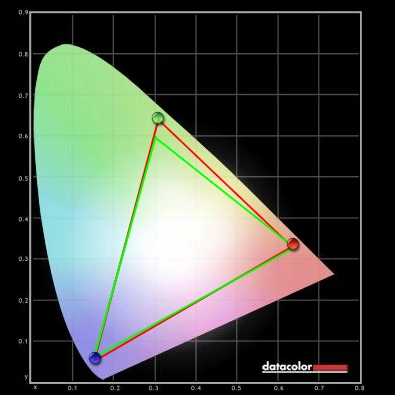
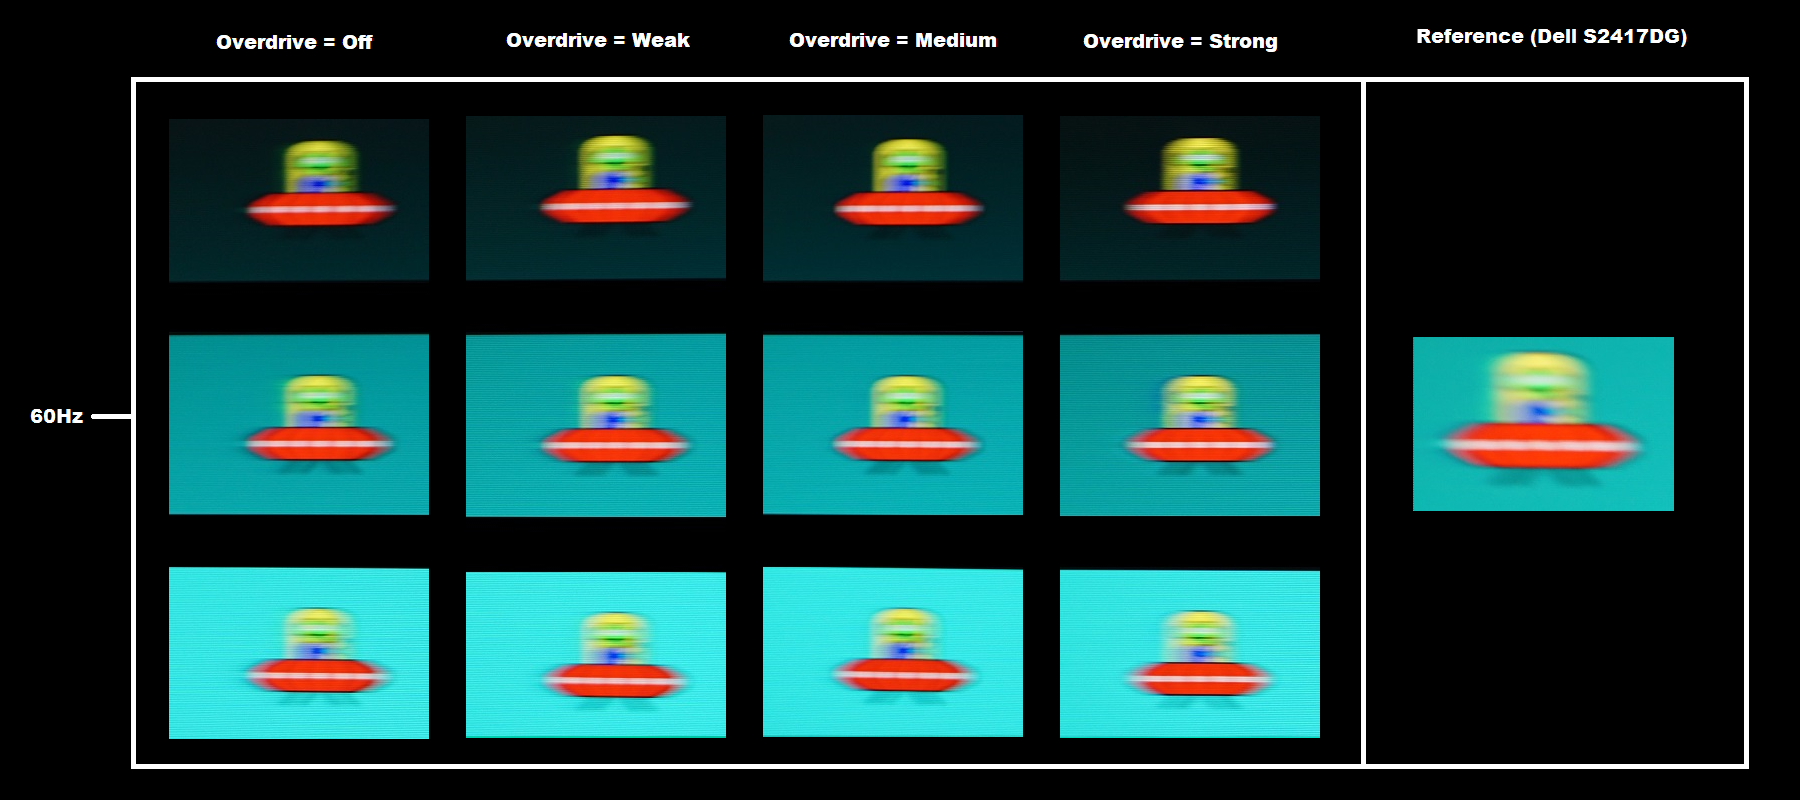
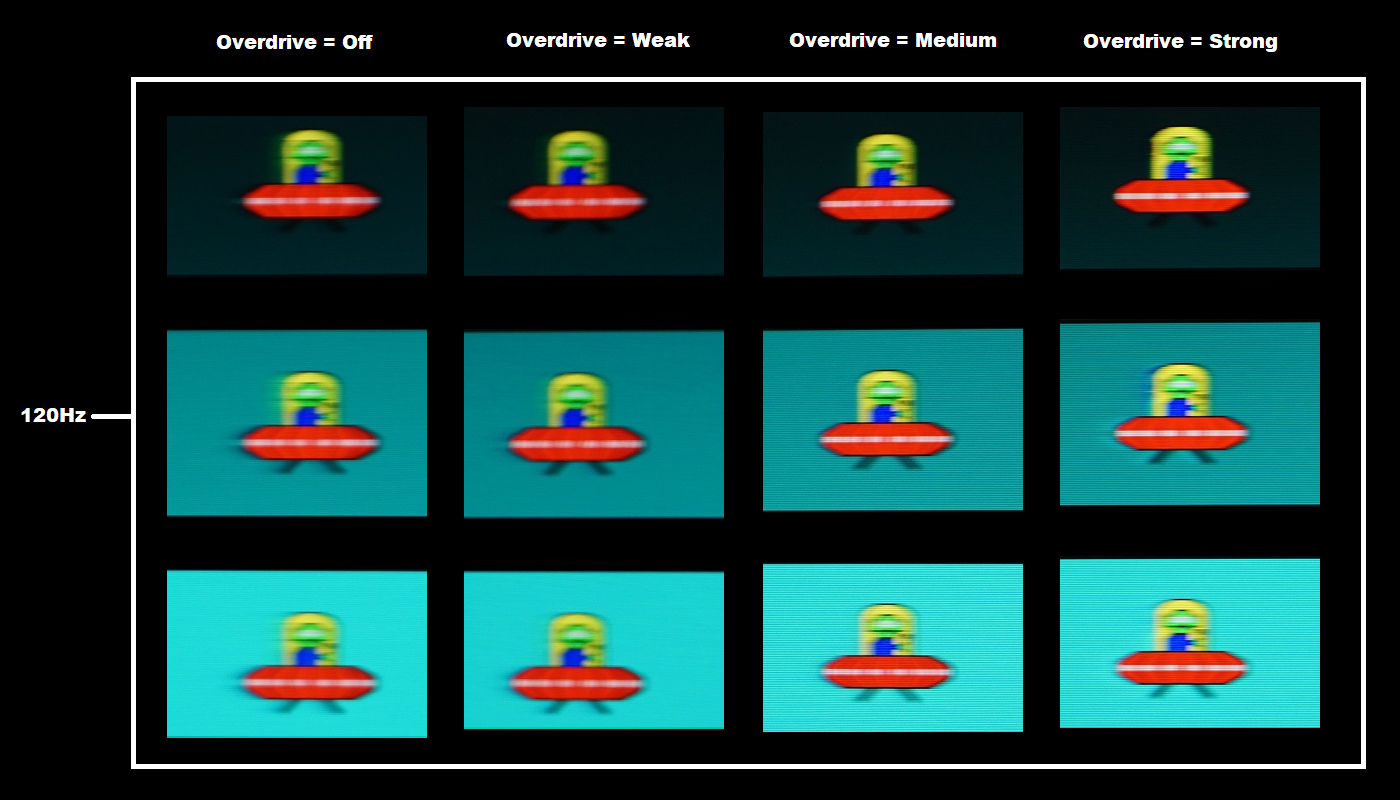
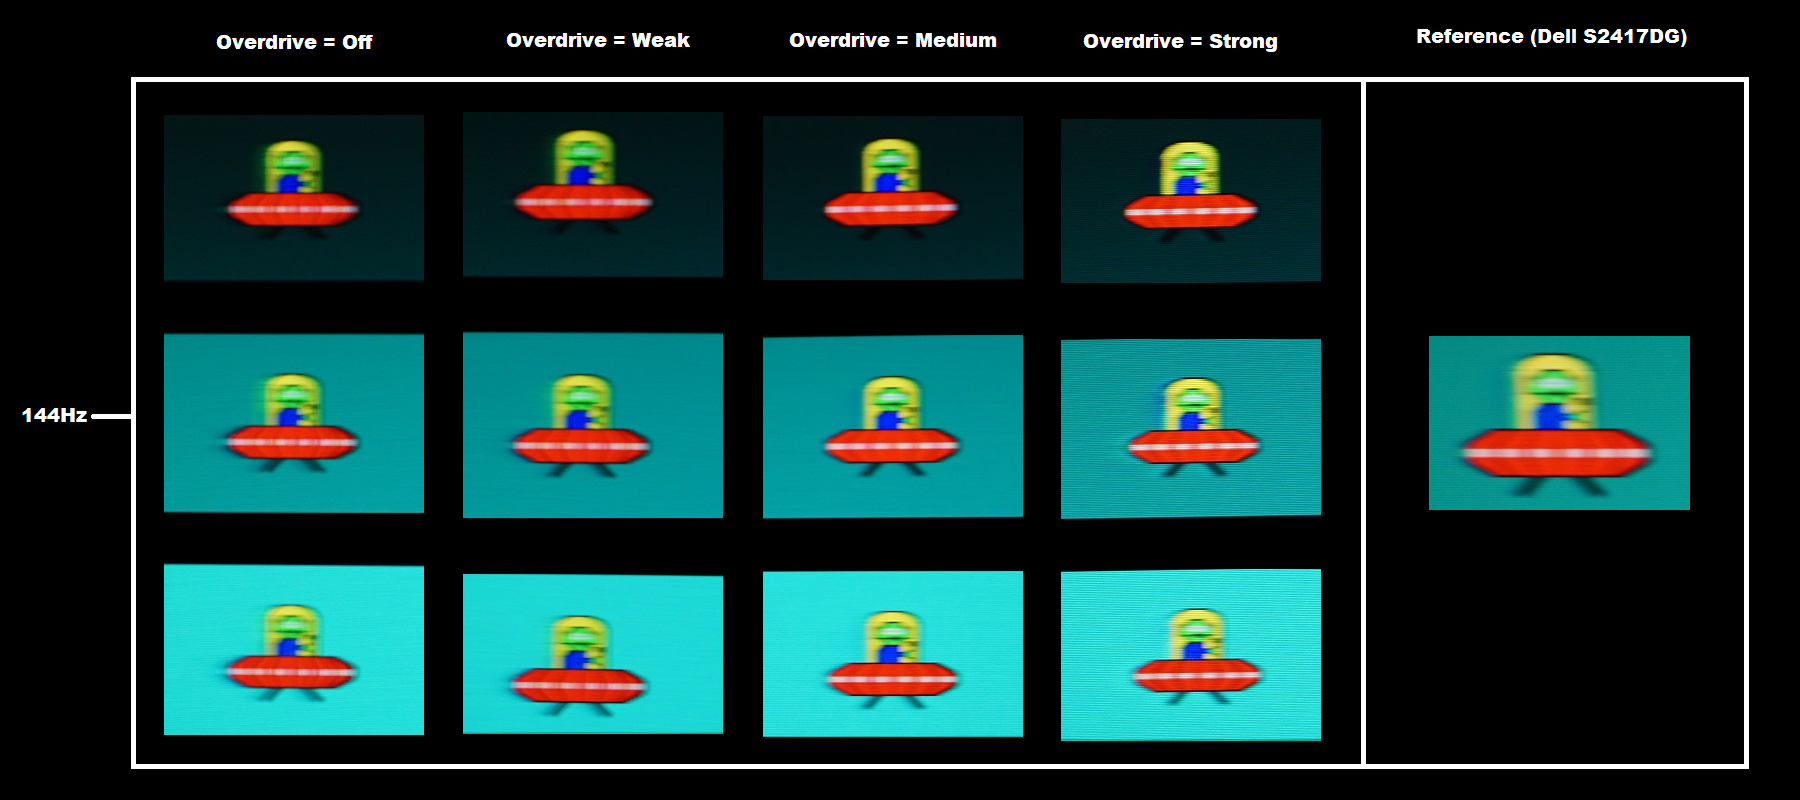
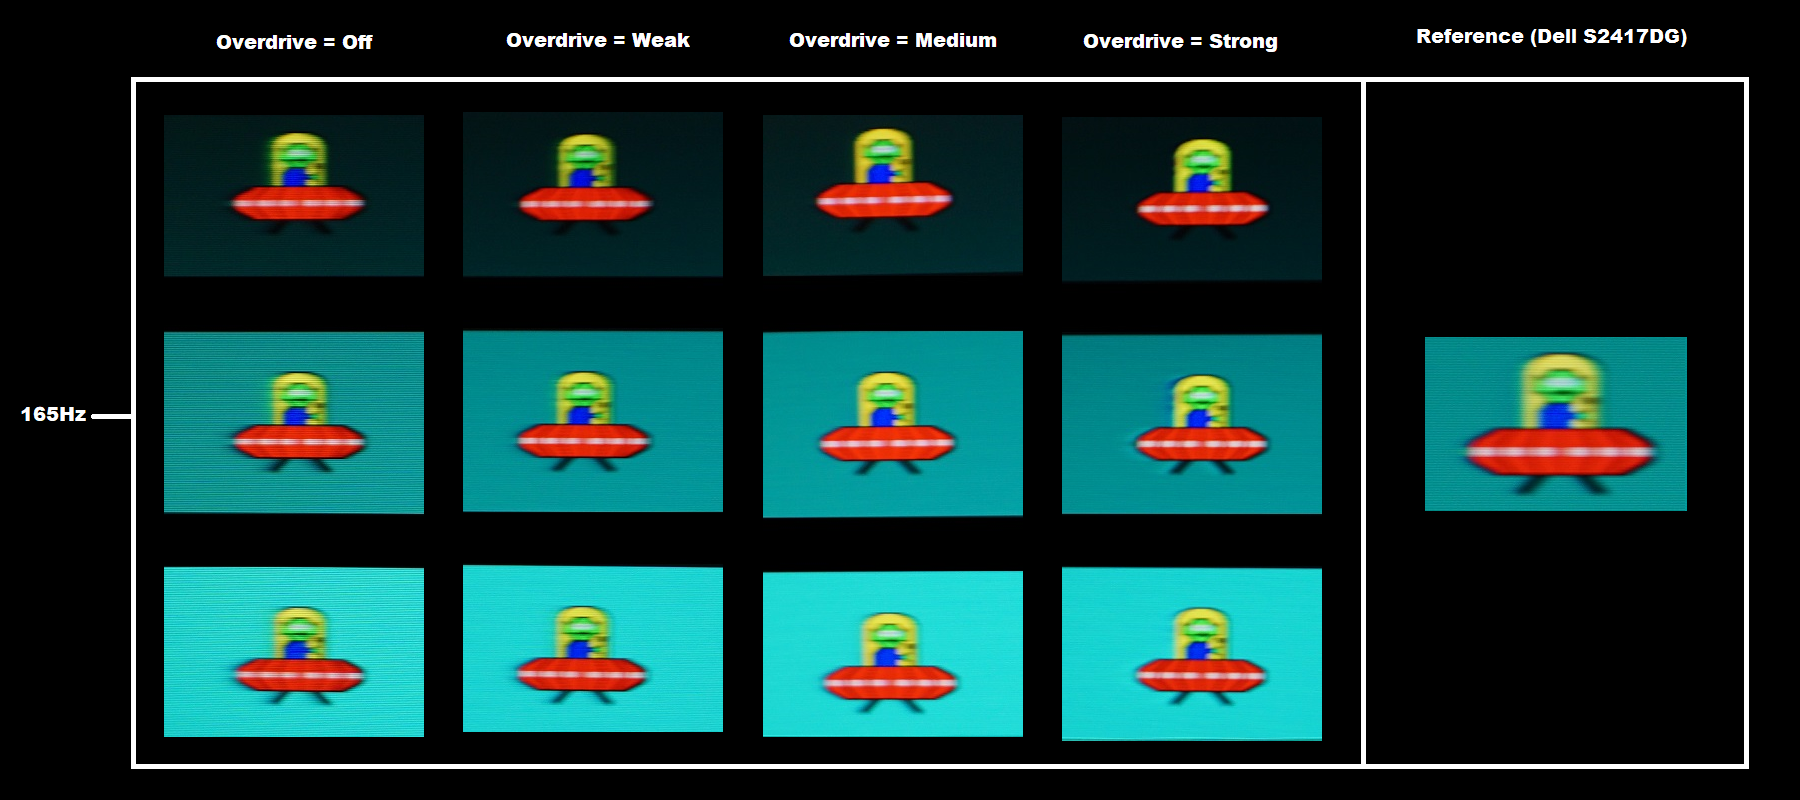
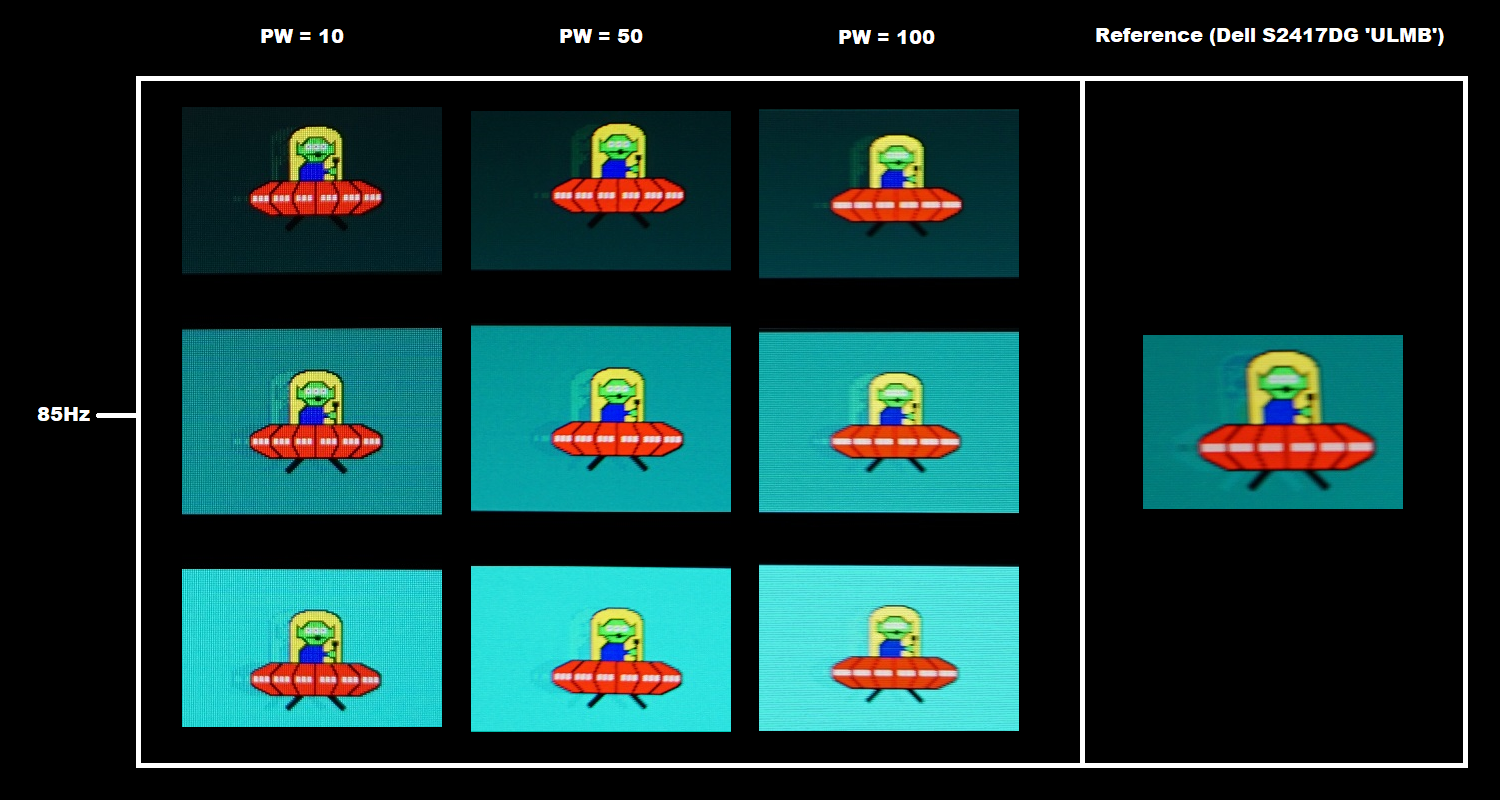
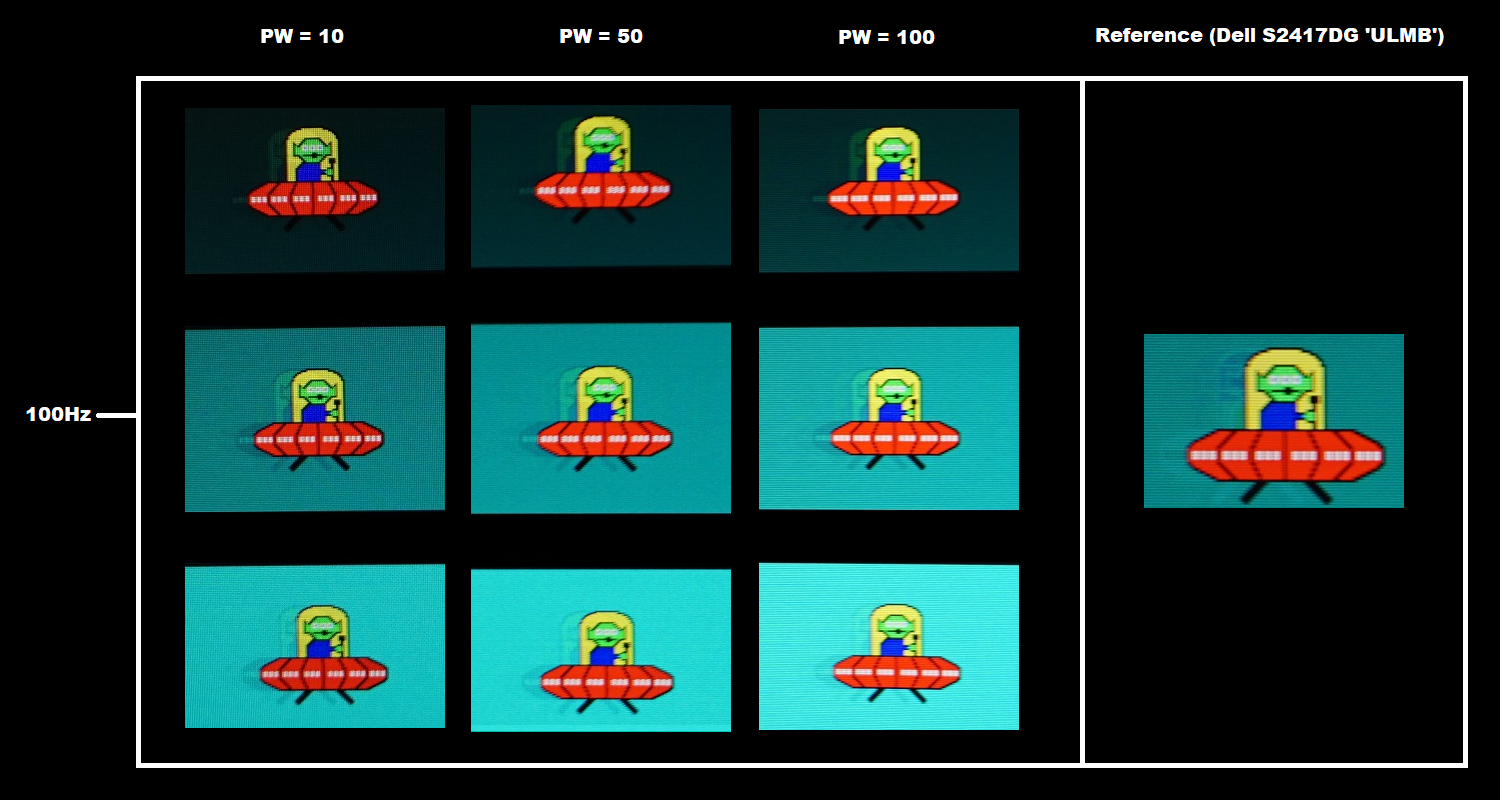
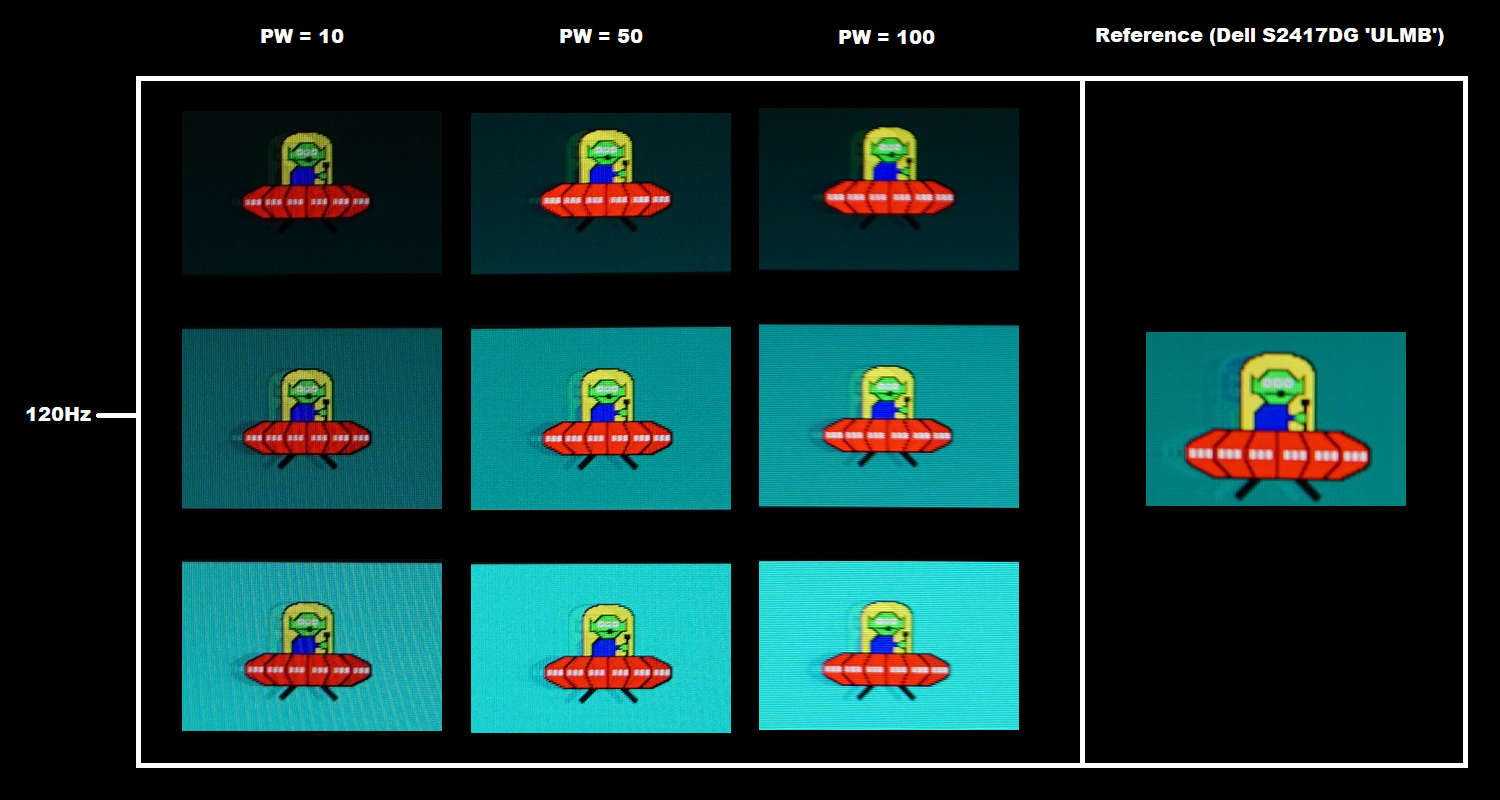
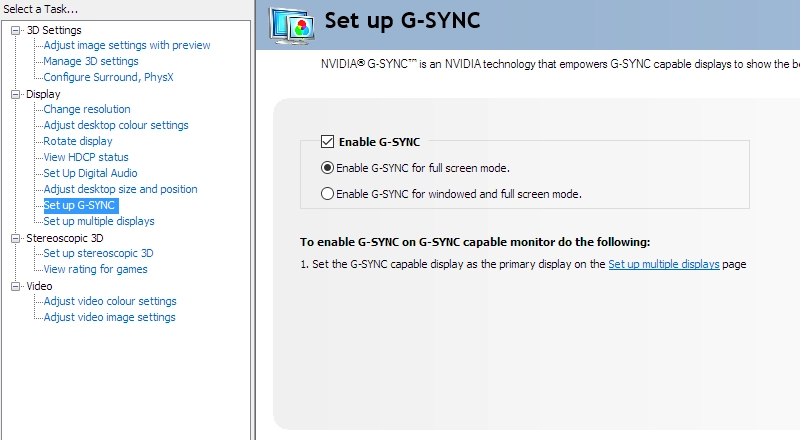
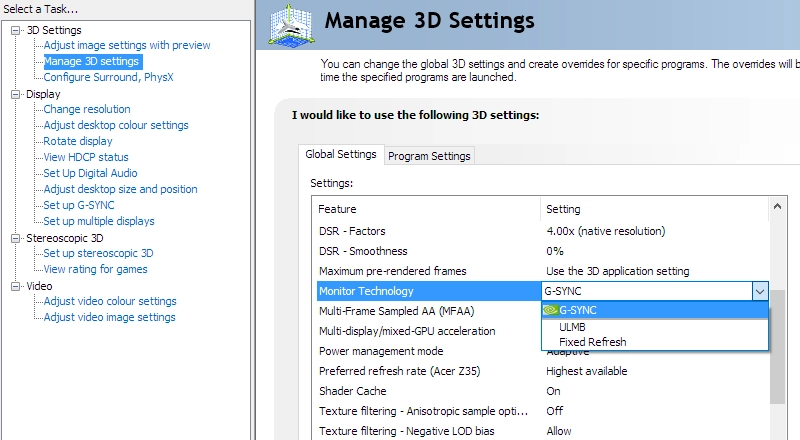
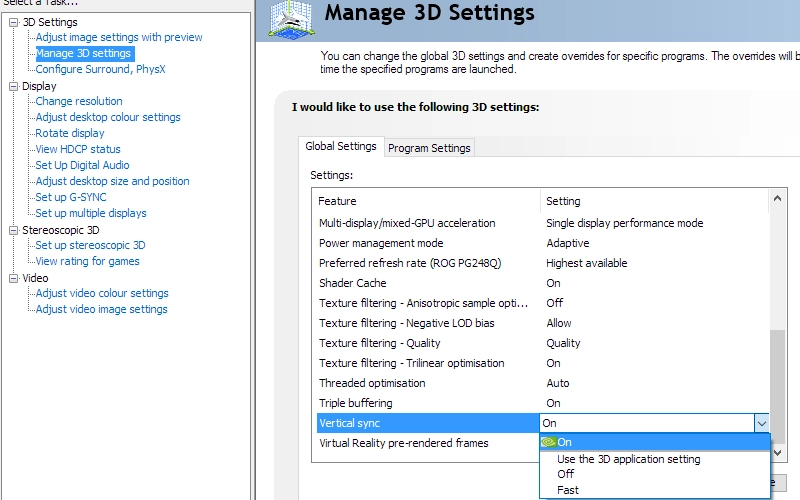
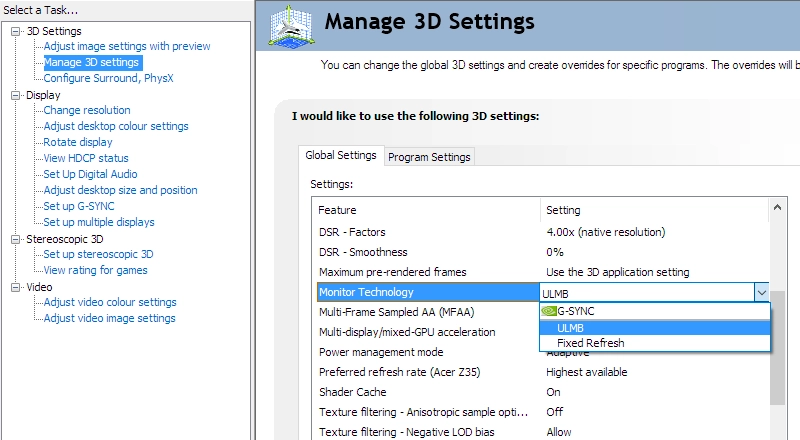
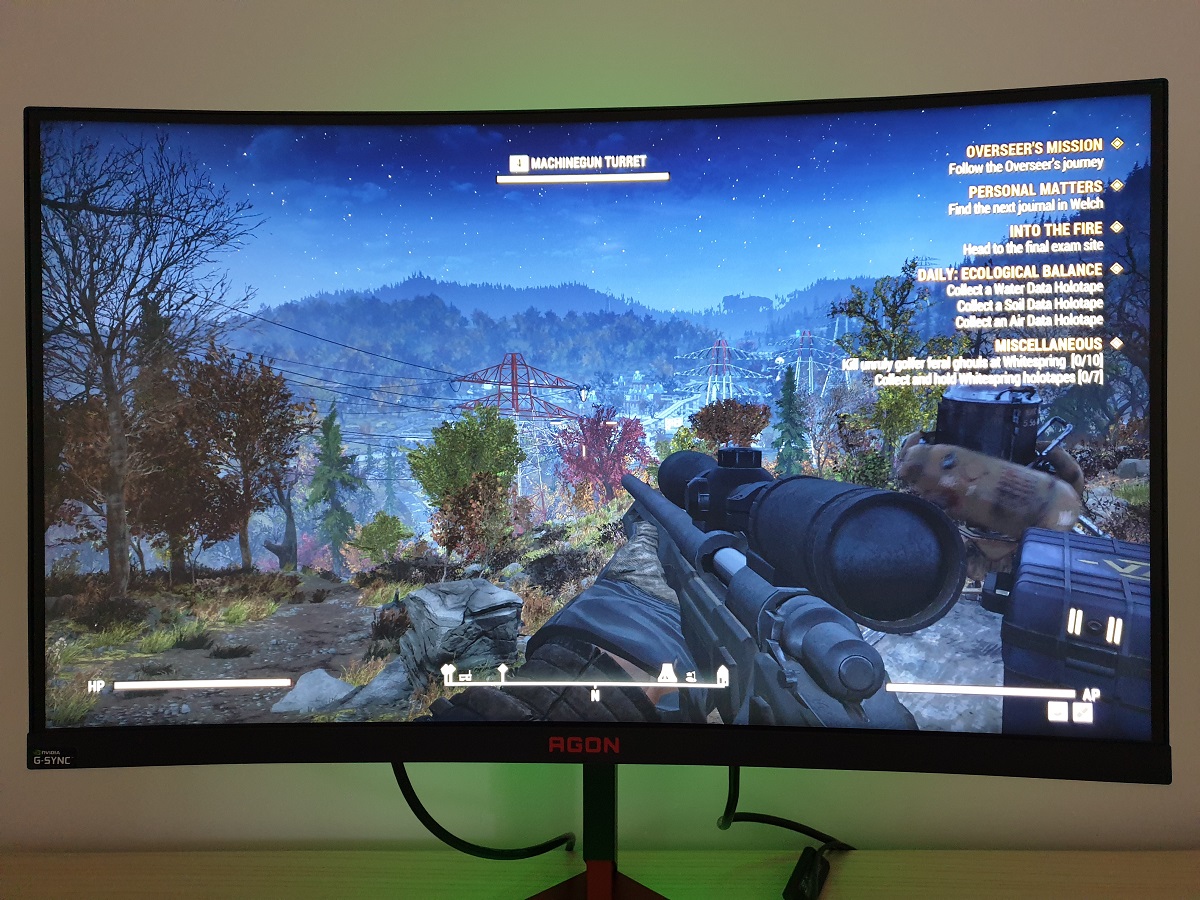
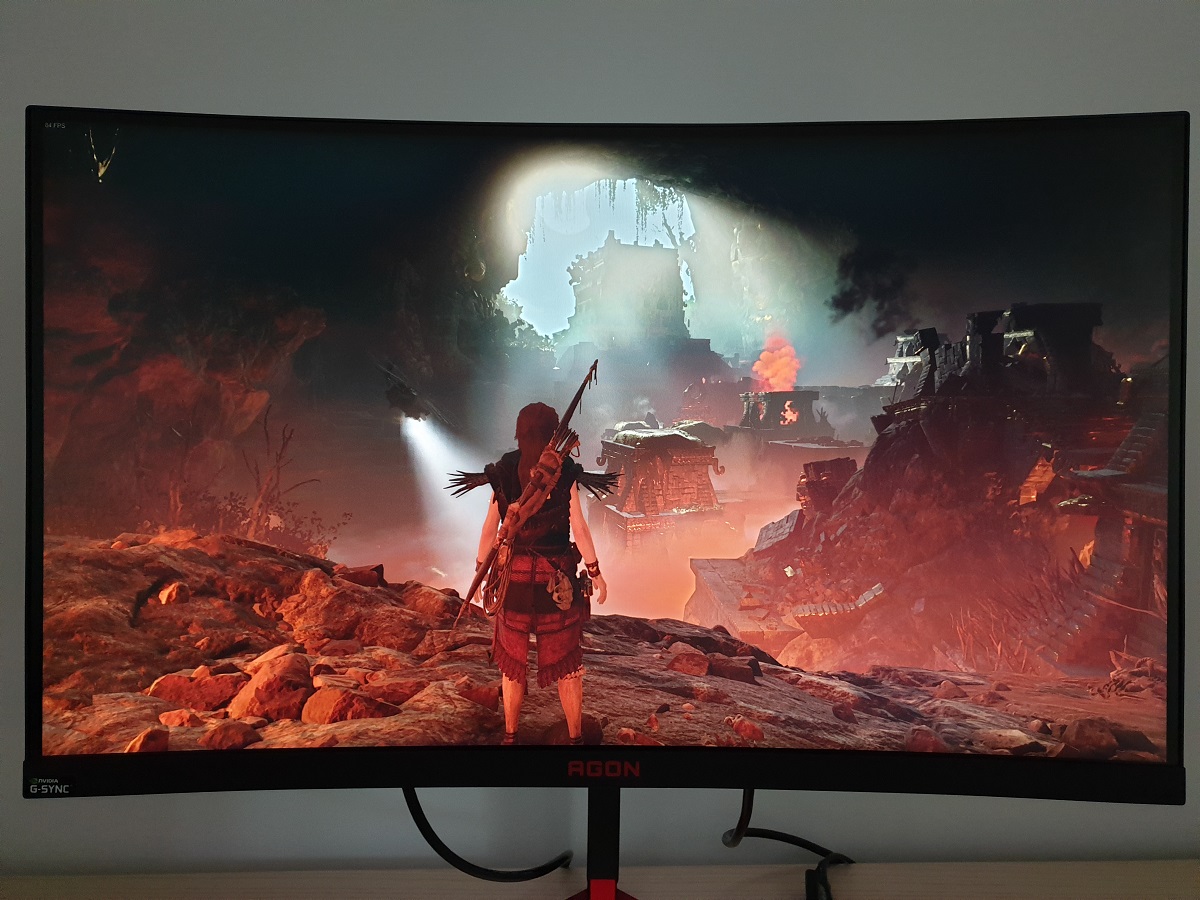
Whilst observing a black background in a dark room, using our ‘Test Settings’, we noticed moderate backlight bleed and clouding, particularly towards the bottom right of the monitor and a bit towards the top. This is shown in the image below. It’s important to remember that individual units vary when it comes to all aspects of uniformity, including backlight bleed. You can also observe a slight silver or golden sheen, depending on angle, if you view the monitor from a sharp angle. This so-called ‘TN glow’ appears to ‘bloom out’ as the viewing angle is sharpened further. It’s very different to ‘IPS glow’ and isn’t readily observed from a normal viewing position nor as obvious from steeper angles in comparison. The viewing angle video later on illustrates this blooming effect from steeper viewing angles. The luminance uniformity was variable. The maximum luminance was recorded at ‘quadrant 6’ to the right of centre (161.7 cd/m²). The greatest deviation from this occurred at ‘quadrant 1’ towards the top left of the screen (127.6 cd/m², which is 21% dimmer). The average deviation between each quadrant and the brightest recorded point was 12.25%, which is fairly high. Note that individual units vary when it comes to uniformity and you can expect further deviation beyond the points measured. Also note that there are perceived brightness shifts due to TN viewing angle limitations that aren’t accounted for by colorimeter measurements. The contour map below shows these deviations graphically, with darker greys representing lower luminance (greater deviation from brightest point) than lighter greys. The percentage deviation between each quadrant and the brightest point recorded is also given. Due to viewing angle limitations of the TN panel technology, we will not be providing colorimeter-based analysis of the colour temperature uniformity of the monitor. The perceived colour temperature can vary significantly depending on which part of the screen you’re observing, from a normal viewing position. Any readings provided here have the potential to be highly misleading. On Battlefield V the monitor provided a decent contrast experience. The visibility of dark shades was largely appropriate for the central mass of screen. This contrasts with models like the Dell S2716DG where gamma issues reveal too much detail. And even after calibration you’re left with a certain ‘blocky’ effect for some dark content rather than things appearing blended (as they did here). Lower down the screen the level of detail was higher than intended due to perceived gamma decreasing and further up the screen detail was masked. This is typical for a TN model and related to perceived gamma shifts due to viewing angle. Lighter elements such as fires and torches at night appeared quite grainy rather than pure, due to the screen surface. But they contrasted reasonably well with darker surroundings. The depth of the dark areas certainly wasn’t as good as some models (particularly VA models), but pretty much as we expected given the panel type used. On Shadow of the Tomb Raider the monitor provided a reasonable contrast performance overall. This title has many dark scenes with caves, tombs and passageways that are very dimly lit. The monitor didn’t provide the sort of depth or atmosphere you’d see on a model with much stronger contrast, such as a decent VA panel. But things didn’t really look out of the ordinary for a TN model, despite the recorded static contrast for our ‘Test Settings’ falling a fair bit below 1000:1. Detail levels were largely appropriate for the central bulk of the screen, as with Battlefield V, with some detail loss further up the screen and some extra (unintended) detail lower down. The loss of detail further up the screen was slightly bothersome on this title in that there are a lot of vertical puzzles to solve which involve climbing. And it was difficult to see which surfaces were porous (i.e. climbable) without adjusting viewing position and glancing down slightly at the monitor. Lighter shades again appeared fairly grainy due to the screen surface rather than smooth and ‘pure’. There was at least no ’IPS glow’ towards the periphery of the screen to contend with, however. We also observed the film Star Wars: The Last Jedi. The contrast performance was again quite reasonable. Nothing spectacular, but nothing which massively impeded the experience in an appropriately lit room. There were plenty of high contrast scenes in this title such as roaring fires and battles in space (often at the same time) and the look wasn’t particularly deep or cinematic, but not flooded or washed-out either. The lack of ‘IPS glow’ is something some users would appreciate, though. And some users might not mind the screen surface as much as we did, perhaps consider it a free film-grain effect or something. It’s also important to note that film content (particularly but not exclusively when streamed) is full of so-called ‘compression artifacts’. On this model these appeared quite blended for the central mass of the screen, as they should look, so they didn’t catch the eye. That contrasts with some models, such as the Dell S2716DG, whereby the compression artifacts are far more visible than they should be – giving a blocky appearance to some darker scenes. The Lagom tests for contrast allow specific weaknesses in contrast performance to be identified. The following observations were made. The colour gamut of the AG273QCG (red triangle) is compared with the sRGB colour space (green triangle) in the image below. The monitor offers good sRGB coverage (99%), with a little under-coverage in some regions and a bit of over-extension in the green region. This allows the monitor to potentially output most shades within the sRGB colour space, with a bit of extra vibrancy in places. The vibrancy potential is not as high as models with more generous colour gamuts, however. On Battlefield V the monitor provided quite a rich palette of colours. Certainly richer than TN models with significantly lower than desirable central gamma. The viewing angle restrictions of the TN technology meant that perceived gamma was lower further down the screen (less depth and saturation) and higher further up the screen (extra depth and saturation). As such, there was a fair bit of undersaturation lower down the screen, although this shift was not as pronounced as on your typical 24” 144Hz TN model. Although less saturated than ideal, we wouldn’t go as far as to call the image ‘washed out’ in this region. Some greens of vegetation and earthy browns appeared a bit lacklustre and more of a pastel shade than intended here, but they still had a decent bit of depth and variety. There were some decent flashes of more vibrant-looking shades such as glowing yellow, orange and red flames. Towards the top of the screen things like this looked overly deep and quite cinematic (again, a TN viewing angle restriction). On Shadow of the Tomb Raider similar colour reproduction characteristics were apparent. Things again appeared quite rich overall, less so further down the screen but still far from ‘washed out’ in our view. There were some nice lush forest green shades, good rich earthy browns and fairly (but not excessively) vivid sky blues for shown for the central mass of the screen. Lara’s skin tone is something we’ve become almost obsessed with when testing monitors. And it’s quite a nice way of encapsulating colour consistency issues with monitors. She looked more or less as she should for the central mass of the screen, but her skin did appear too pale lower down the screen. Above the central region she received a ‘healthy tan’, becoming quite overdone near the top. These shifts are quite typical for TN models, but were again less pronounced than on some high refresh rate Full HD TN models. To round off, we made observations using the Blu-ray of Futurama: Into the Wild Green Yonder. This is an excellent test for colour consistency, with large areas of individual shade filling the screen. The aforementioned shifts in gamma and saturation were readily apparent on this title, particularly if you observed shades such as the skin tones of certain characters (including the lobster red of Dr. Zoidberg). Particularly vertically, you could see Dr Zoidberg appear overly pale lower down the screen, verging on crimson further up the screen but a more appropriate shade centrally. These shifts were fairly modest for TN models, not extreme relatively speaking. There were some good eye-catching neon shades and some nice muted pastel shades as well. The shifts in saturation affected the individuality of these shades, with closely matching shades ‘overlapping’ at different sections of the screen so to speak, but the overall look was fairly rich and varied. Lagom’s tests for viewing angle tests were used to further explore colour consistency and viewing angle performance. The following observations were made from a normal viewing position, eyes around 70cm from the screen. On some monitors, particularly but not exclusively those with high refresh rates, interlace patterns can be seen during certain transitions. We refer to these as ‘interlace pattern artifacts’ but some users refer to them as ‘inversion artifacts’ and others as ‘scan lines’. They may appear as an interference pattern or mesh or interlaced lines which break up a given shade into a darker and lighter version of what is intended. They often catch the eye due to their dynamic nature, on models where they manifest themselves in this way. Alternatively, static interlace patterns may be seen with some shades appearing as faint horizontal or vertical bands of a slightly lighter and slightly darker version of the intended shade. We did not observe any static interlace pattern artifacts, although we did observe some dynamic interlacing patterns in places. They were generally most noticeable when observing lighter shades such as when moving quickly past smoke or observing an explosion or muzzle flash. Also, when scrolling past certain images on web pages. They were far easier to notice and quite widespread with ULMB active, although this is a common observation on models which have them. They’re note specifically linked to refresh rate or G-SYNC activity, however. Most users shouldn’t find them bothersome and some won’t notice them (particularly with ULMB deactivated). We used a small tool called SMTT 2.0 and a sensitive camera to compare the AG273QCG’s latency with a screen of known latency. To help maximise accuracy, over 30 repeat readings were taken. Using the method, we measured 3.89ms (~ 2/3rds of a frame @165Hz) of input lag. This value is influenced both by the element of input lag you ‘feel’ (signal delay) and the element you ‘see’ (pixel responsiveness). It indicates a low signal delay which shouldn’t bother even sensitive users. Unfortunately, we don’t have the means to accurately measure input lag with G-SYNC active in a variable refresh rate environment, but input lag did feel low to us with G-SYNC doing its thing. In our article on the topic, we explore the key factors affecting PC monitor responsiveness. Chief amongst these is the concept of perceived blur, which is contributed to not only by the monitor’s pixel responsiveness, but also the movement of our eyes as we track motion on the screen. This second factor (eye movement) is the predominant contributor to perceived blur on modern monitors, although pixel responsiveness also plays an important role. A method of photography called pursuit photography is also explored. This uses a moving rather than static camera to capture motion on a monitor in a way that simulates both eye movement and pixel responsiveness. This allows both elements of perceived blur to be highlighted, rather than simply capturing pixel responsiveness. The following images are pursuit photographs taken using the UFO Motion Test for ghosting. The test was set to run at its default speed of 960 pixels per second, which is a good practical speed for taking such photographs. The UFOs move across the screen from left to right at a frame rate matching the refresh rate of the display. All three rows of the test are analysed (dark, medium and light cyan background). This forces the monitor to perform a range of pixel transitions and can help highlight the effect of different shades (grey levels) on pixel response speeds. The monitor was tested at 60Hz (directly below), 120Hz, 144Hz and 165Hz using all of the available ‘Overdrive’ settings. For most refresh rates a reference pursuit photograph is also included, from a Dell S2417DG which offers excellent pixel responsiveness and gives a good idea of how things look where pixel responsiveness isn’t really a limiting factor. At 60Hz (above) the UFO appears soft and unfocused, which reflects a significant amount of perceived blur due to eye (camera) movement. There is also a little bit of trailing behind the object in some cases, which is down to weaknesses in pixel responsiveness. With ‘Overdrive = Off’ there is a slight powdery trail behind the object, most noticeable behind the cockpit area of the medium background (middle row). The ‘Weak’ setting reduces this a bit, although a little bit of this trailing remains. The ‘Medium’ setting as good as eliminates this trailing and is, if anything, slightly better than the reference shot even. There is a very slight trace of overshoot (inverse ghosting) for the medium background, with a slight shadowy trail behind the UFO. This is very faint and not at all eye-catching. The ‘Strong’ setting introduces more noticeable overshoot, with a stronger shadow and some bright trailing for the medium background. This is not extreme but it’s clear that the ‘Medium’ setting is better optimised here. The image below shows how things look at the significantly higher refresh rate of 120Hz. At 120Hz (above), the object is much more sharply focused and significantly narrower. This reflects a marked decreased in perceived blur due to eye movement. There are again various degrees of trailing behind the object, some of it more noticeable than at 60Hz. With ‘Overdrive = Off’ there is a significant amount of trailing beyond the object, more so than at 60Hz. The pixel response speed requirements are massively increased and the pixel responses are far too slow to provide an optimal performance for the now doubled refresh rate. The ‘Weak’ setting cuts down on the trailing quite a bit, although some remains. The ‘Medium’ setting offers significant further improvement. There is again a trace of overshoot for the medium background, but nothing substantial – a very clean performance overall in this test. The ‘Strong’ setting provides quite eye-catching overshoot, particularly for the medium background where there is a bright and colourful trail behind the object. This is an unnecessarily high level of pixel overdrive, the ‘Medium’ setting is again better optimised. The image below shows things with a slight bump up in refresh rate, to 144Hz. At 144Hz (above) there are only subtle changes from 120Hz. The trailing behaviour is very similar, but the UFO is slightly narrower and more sharply focused. This reflects a slight decrease in perceived blur due to eye movement. The ‘Medium’ setting is again optimal here and provides a good clean performance with no observable trailing or strong overshoot in this test. The image below shows things bumped up again, this time to 165Hz. At 165Hz (above), things are similar to at 144Hz in terms of trailing behind the object. The UFO is marginally narrower and more sharply focused, indicating another slight improvement to perceived blur from eye movement. The ‘Medium’ setting is again optimal in our view. There is a little overshoot but nothing eye-catching on this test, the overall performance is similar to the reference (and that’s a very good thing). Needless to say, we adopted this setting for our subjective testing that follows shortly. We’ve shown with Test UFO, above, that increasing refresh rate with an accompanying rise in frame rate gives a corresponding decrease in perceived blur due to eye movement. The monitor provides an alternative method of (massively) reducing perceived blur due to eye movement; ULMB (Ultra Low Motion Blur). This is an Nvidia-specific strobe backlight feature that can be employed on G-SYNC compatible GPUs instead of G-SYNC. By the mechanisms explored in the linked responsiveness article, this massively reduces eye movement and hence massively reduces perceived blur. Using ULMB causes the backlight to flicker at a frequency matching the refresh rate – 85Hz, 100Hz or 120Hz can be selected. Note that individual tolerance to flickering varies, particularly at the upper end of selectable ULMB refresh rates it’s sometimes a trade-off competitive gamers are willing to make. The image below shows the monitor with ULMB active at 85Hz. ‘PW’ refers to ‘Pulse Width’, with 3 settings tested; ‘10’ (lowest), ‘50’ and ‘100’ (maximum). A higher setting increases the length of time of the ‘on’ phase of the strobe, resulting in a brighter image at the expense of motion clarity. Note that ‘Overdrive’ can’t be changed when ULMB is active. With ULMB enabled, at 85Hz (above) you can see that the object is far narrower and more sharply focused even when compared to 165Hz with the technology disabled. Particularly with ‘PW = 10’, you can see excellent detail on the UFO itself – you can count the little white dots for example. At ‘PW = 50’ things are more blended together in that respect but still nicely detailed. And a setting of ‘100’ loses the finer details, although things are still clearly more sharply focused than with ULMB disabled at any refresh rate. There is also significant trailing behind the UFOs, however. A faint repetition of the object. This is ‘Strobe Crosstalk’, which occurs due to the pixel responses not keeping up with the rigorous demands of the refresh cycle. Very much like conventional trailing, separated out into a distinct repetition by the strobe behaviour of the backlight. This contrasts with the reference image which shows overshoot instead. The image below shows how things look with ULMB set to 100Hz. At 100Hz with ULMB there is a bit of an improvement in clarity and detail levels compared to at 85Hz, with the respective PW setting. The white dots are a bit more distinct at ‘PW = 100’ compared to at 85Hz where they were blended together, for example. The strobe crosstalk behaviour is slightly bolder. The final image, below, shows things with ULMB active at 120Hz. At 120Hz you can see another slight bump up in detail levels at each respective PW setting. The level of detail for the UFO is exceptional compared to with ULMB deactivated, indicating a massive decrease in perceived blur due to eye movement. But there is again that strobe crosstalk to contend with, which is somewhat bolder than at 100Hz. We didn’t actually find the differences in strobe crosstalk to be all that noticeable in practice when comparing different refresh rates with ULMB active. It was something we noticed regardless, as we’ll discuss in an in-game setting shortly. We certainly preferred the improved ‘connected feel’ and lower flickering of the highest possible refresh rate when ULMB was active (i.e. 120Hz), however. On Battlefield V the 165Hz refresh rate was put to excellent use by the monitor, where frame rate kept pace. The monitor had an excellent ‘connected feel’, describing the level of precision and fluidity as you interact with the game world. This is contributed to both by the low latency coupled with the fact the monitor is updating its visual output 2.75 times as often as a 60Hz model (at 60fps). The high refresh rate and frame rate also hugely decreased perceived blur, as demonstrated earlier with Test UFO. On games like Battlefield V this makes it easier to track and engage enemies and keeps your in-game environment more focused during movement. We felt this combination of significantly lower perceived blur and significantly higher ‘connected feel’ gave a very nice competitive edge compared to playing at significantly lower frame rates (or refresh rates). The bump up from 144Hz (at 144fps) to 165Hz (165fps) wasn’t dramatic but was to us still noticeable. The slight decrease in perceived blur was demonstrated earlier with Test UFO, but it was more the slight edge in ‘connected feel’ that we enjoyed. The monitor didn’t provide us any real cause for concern with its pixel responsiveness, which is also an important factor to consider when it comes to perceived blur. It provided a very ‘clean’ 165Hz performance overall, without noticeable trailing from slower than optimal pixel transitions and no obvious overshoot (inverse ghosting) from excessive grey to grey acceleration. There were some hints of overshoot in places, for example when observing medium-dark objects (such as a tree trunk) against a brighter background (daytime sky) you could see a slight trail that was brighter than the background colour. But this wasn’t something we found eye-catching or obnoxious. Certainly compared to models like the Dell S2716DG, where the overshoot was much more pronounced and widespread. Shadow of the Tomb Raider provided a similar experience, with a solid 165Hz performance and no standout weaknesses. We didn’t find the overshoot bothersome or obvious, generally having to hunt it down rather than it being something that is passively observed. The ‘connected feel’ and reduced perceived blur and the competitive edge it provides was less important for this style of game, but the benefits were still there and a very welcome addition. We also made observations using movie content of a variety of frame rates. There were no clear weaknesses evident here. Particularly for the 24fps or 30fps content, the frame rate itself massively limited fluidity. The monitor already performed very nicely at 165fps, so when you reduce the frame rate the pixel response requirements for optimal performance are also reduced. There were some slight traces of overshoot (bright trailing) in places, but we didn’t find this eye-catching and was mainly observed for higher frame rate movie content (50fps+). We didn’t observe any issues with trailing from slower than optimal pixel transitions. Nvidia G-SYNC is a variable refresh rate technology that can be activated when a compatible Nvidia GPU is connected to a compatible monitor (such as the AOC AG273QCG). Our article on the technology explores the principles behind the technology and its benefits, so we won’t be repeating too much of that. Essentially the technology allows the monitor to dynamically adjust its refresh rate to match, where possible, the frame rate outputted by the GPU. When the two are in sync it gets rid of the tearing (VSync off) and stuttering (VSync on) that occurs when the two are unsynchronised. An additional benefit for those who hate tearing and usually like to use VSync is a reduction in latency compared to ‘VSync on’ in the variable frame rate environment. As noted in the responsiveness section, though, we don’t have a way to accurately measure this. This monitor supports G-SYNC via DP 1.2 (DisplayPort), once connected to a compatible Nvidia GPU such as the GTX 1080 Ti used by our test system. Once connected up, G-SYNC should be automatically configured and ready to use. There’s usually even a little notification icon in the system tray telling you that a G-SYNC compatible display is detected. To check everything is configured correctly, open Nvidia Control Panel and navigate to ‘Display – Set Up G-SYNC’. Ensure that the checkbox for ‘Enable G-SYNC’ is checked, then select your preferred operating mode. As the image below shows, this technology works in both ‘Full Screen’ and ‘Window’ modes, provided the correct option is selected for this. If the G-SYNC options seem to be missing from Nvidia Control Panel, this may be remedied by reconnecting the GPU or possibly connecting the monitor to a different DP output if there’s one available. If the options are still missing, reinstalling the GPU driver or updating this is recommended. Next you should navigate to ‘Manage 3D settings’. Here there are a few settings of interest, the first of which is ‘Monitor Technology’. This should be set to ‘G-SYNC’ as shown below. Assuming this is all set up correctly, you should see ‘NVIDIA G-SYNC’ listed as ‘Mode’ in the ‘Extra’ section of the OSD menu. The refresh rate listed there just corresponds to the static refresh rate you’ve selected in Windows or your game. If you activate the ‘Frame Counter’ in the ‘Game Setting’ section of the OSD, though, this will correspond with the frame rate of your game if G-SYNC is active (with the game running between 30 and 165 fps). The second setting of interest is VSync, which can be set to one of the following; ‘On’, ‘Use the 3D application setting’, ‘Off’ or ‘Fast’ (GPU dependent). The AOC supports a variable refresh rate range of 30 – 165Hz, with the maximum value (ceiling) corresponding to the refresh rate you’ve selected for the monitor in Windows. That means that if the game is running between 30fps and 165fps, the monitor will adjust its refresh rate to match. When the frame rate rises above 165fps, the monitor will stay at 165Hz and the GPU will respect your VSync setting in the graphics driver. If you select ‘On’, VSync activates if the frame rate exceeds the static refresh rate that you’ve selected (e.g. 165Hz / 165fps) and the usual VSync latency penalty applies. If you select ‘Off’ then the frame rate is free to rise in an unrestricted way, but the monitor will only go as high as 165Hz – tearing and juddering will ensue if the frame rate rises above this. The ‘Use the 3D application setting’ largely works as you’d expect, but the general recommendation is to set VSync in the graphics driver if you wish to use it as in-game implementations can interfere with the smooth operation of G-SYNC. Some users prefer to leave VSync disabled and use a frame rate limiter set several frames below the maximum supported (e.g. 161fps) instead, avoiding any VSync latency penalty at frame rates near the ceiling of operation or tearing from frame rates rising above the refresh rate. The ‘Fast’ option is available on some newer GPUs, such as the GTX 1080 Ti used in our test system. This enables a technology called ‘Fast Sync’, which only applies above the refresh rate and frame rate ceiling (>165Hz / 165fps). Below this G-SYNC operates as normal, whereas above this a special version of VSync called ‘Fast Sync’ is activated. This is a GPU rather than monitor feature so isn’t something we will explain in detail, but it is designed to reduce tearing at frame rates well above the refresh rate of the monitor. If you’re interested in this technology, which may be the case if you play older or less graphically demanding games at very high frame rates, you should watch this section of a video by Tom Petersen. If the frame rate drops below the lowest refresh rate supported by the monitor (i.e. the G-SYNC floor of 30Hz / 30fps) then the monitor sets its refresh rate to a multiple of the frame rate. This occurs regardless of VSync setting. If for example the game ran at 26fps, the monitor would set itself to 52Hz. This keeps stuttering and tearing from the usual frame and refresh rate mismatches at bay. As we explore shortly, though, low frame rates are low frame rates regardless of the technology. So whilst it is always beneficial to have stuttering and tearing removed, it’s also beneficial to have an elevated frame rate where possible. It’s also worth remembering that G-SYNC can’t eliminate stuttering caused by other issues on the system or game environment such as insufficient RAM or network latency. And finally, you can’t activate ULMB and G-SYNC at the same time – both technologies will work on compatible Nvidia GPUs, but can’t be used simultaneously. We used a range of titles to test G-SYNC, but found the technology worked consistently well on all of these. So we’ll simply be focusing on a single title for this section; Battlefield V. This title offers good flexibility in the graphics settings, allowing the full range of refresh rates supported by G-SYNC on the monitor to be tested. Using fairly modest settings there were frequent dips below the 165fps ceiling of operation for the monitor. Without G-SYNC this sort of departure would cause a frame rate and refresh rate mismatch that gives obvious (to us) stuttering if VSync is on or tearing and juddering if VSync is off. With G-SYNC the experience ‘flowed’ in much more of a smooth way, without interruption from such things. Regardless of G-SYNC being active, there was still an advantage in getting the frame rate as high as possible. Reduced frame rate increases perceived blur and worsens the ‘connected feel’. This became more obvious if graphics settings were increased or in particularly intense scenes where frame rate dropped into the double digits. The difference between ~165fps and 100fps is something we certainly noticed, although the overall ‘connected feel’ and perceived blur levels remained decent. Dropping off below that was quite jarring, particularly if you’d just come from much higher frame rates. The tearing or stuttering without G-SYNC active, though, made the experience a lot more painful. And at these reduced frame rates stuttering in particular becomes painfully obvious. It’s important to remember that individual sensitivity to tearing and stuttering varies, as does the effect of frame rate. We found G-SYNC a nice addition to the monitor, but still enjoyed the highest possible frame rates. It certainly made slight dips in frame rate a lot more palatable to us. Even as frame rate dropped well below 80fps, the monitor provided a sensible level of pixel overdrive which adapted properly to the lower frame rate and refresh rate. This contrasts with many FreeSync models, which are often tuned to the highest refresh rate of the monitor but use excessive acceleration for lower refresh rates. The result is much more obvious overshoot as the frame rate (and hence refresh rate) decreases. On this model this wasn’t an issue, although it rarely is on G-SYNC models. Nvidia tunes the pixel overdrive for a range of refresh rates, something they call ‘Variable Overdrive’, rather than simply optimising for decent high refresh rate performance. We’ve introduced ULMB earlier, including its principles of operation and its effect on perceived blur using the UFO Motion Test for ghosting. This section will explore how to activate the technology and also provide some subjective analysis of the experience when gaming. ULMB can be enabled by first setting the monitor to a supported refresh rate (85Hz, 100Hz or 120Hz). The next step is to navigate to ‘Manage 3D settings’ in the Nvidia Control Panel and select ‘ULMB’ for ‘Monitor Technology’ as shown in the image below. There is also a ‘ULMB’ setting in the ‘Gsync Setting’ section of the OSD for the monitor, which should be enabled – this generally happens automatically if the monitor is set to an appropriate refresh rate and driver option anyway. An additional setting called ‘ULMB Pulse width’ can be configured in the OSD, which adjusts the length of the ‘on phase’. A lower setting reduces the length of the ‘on phase’, resulting in a dimmer image but potentially offering further improvement in motion clarity. Most users will find that a high ‘Pulse Width’ setting delivers a nice low level of perceived blur and won’t find the slight benefits of lowering this much noticeable. Although many will also find a setting of ‘100’ too bright (with default monitor brightness) so might prefer lowering this a bit according to preferences, perhaps to around ’60 or ‘70’. You should notice a change in the image brightness and perhaps notice a mild flickering with ULMB enabled, especially when you first activate it. You can also confirm that it is activated by navigating to the ‘Extra’ section of the OSD and seeing whether ‘Mode’ is listed as ‘ULMB’. It’s very important to understand that ULMB or indeed any strobe backlight feature will only work properly if your frame rate is able to consistently match the refresh rate of the display. Without this, you’ve got very little perceived blur (due to eye movement) to mask stuttering or juddering. This becomes painfully obvious and it just doesn’t look pleasant at all. With Battlefield V running at a solid 120fps, we found the significant decrease in overall perceived blur to be very easy to notice. The setting very much did what it said on the tin in that respect, delivering ultra low levels of motion blur. Even during rapid manoeuvres in vehicles or rapidly moving the mouse whilst on foot, the level of clarity retained in the in-game environment was excellent. This can provide a nice competitive advantage, making it easier to spot and track enemies during such rapid manoeuvres. Having said that, there was quite a bit of strobe crosstalk on this model as we identified earlier. We observed objects appear with a faint repetition of said object during fast motion in particular, much as demonstrated on TestUFO earlier. We found this easy to notice when gaming and found it quite eye-catching, although sensitivity to this varies and some users would still find the overall low levels of perceived blur to be a nice bonus. Whilst observing movie content we found a bit of a reduction in perceived blur was apparent with ULMB active. This was more noticeable for 60fps content (on YouTube, for example) as ~24fps content is far too restrictive in terms of frame rate, with an underlying juddering due to the low frame rate. For fast pans on 60fps content the edge in perceived blur was noticeable, although less so than for frame rate gaming content. 60fps also worked well as it divides nicely into 120Hz (each frame displayed twice) and we found the strobe crosstalk was masked at this sort of relatively low frame rate as well. ULMB isn’t something we personally make much use of and prefer instead to use G-SYNC instead. The flickering, more noticeable ‘interlace pattern artifacts’ and strobe crosstalk on this model didn’t appeal to us. Neither did the requirement to have the frame rate consistently matching the refresh rate to avoid painfully obvious stuttering. Finally, we preferred the ‘connected feel’ of 165Hz at suitably high frame rates. But some users do like the significantly lower perceived blur offered by ULMB. And although the implementation on this monitor was far from perfect, it did work for its intended purpose and it’s there if you wish to use it. Curved monitors are nothing new to us here, we’ve used quite a few now. But this is the first curved model that uses a TN rather than VA or IPS panel we’ve used. That fact alone did not change the experience of the curve itself and the (subtle) effect on the image. The AG273QCG features a 1800R curve and a 2560 x 1440 (WQHD) resolution. The resolution brings with it a fairly good pixel density and a decent amount of useful ‘real-estate’ on the screen, whilst keeping things a good size for many users to use without scaling or application-specific zoom. It also provides a nice level of detail for games, suitably high-resolution images and other content. Users who haven’t experienced a curved monitor in person may observe images and feel that the curve would make the image feel unnatural or distorted. Indeed, images tend to exaggerate the effect greatly. In reality the effect of the curve is subtle, an addition that we find easy to get used to. Some users (and indeed manufacturers and researchers) may claim there are viewing comfort benefits to be had as well, with the curve creating a more uniform viewing distance between your eyes and different sections of the screen. We found the monitor perfectly comfortable to use, but don’t generally have an issue with flat screens in that respect either. The only users we feel should ‘fear’ the curve are designers or those who require geometric perfection for their work, others should judge with their own eyes and certainly not dismiss based on potentially misleading images. Speaking of which, we’ve included shots showing the monitor on the desktop below. These certainly exaggerate the curve but are there to give a rough feel for how things look. As per the previous paragraph, the screen size and curvature added some immersion to the experience. It simply ‘drew us in’ to the game environment a bit better without making the experience feel uncomfortable or alien. This effect is more pronounced with a curve of this sort of steepness (or more so if steeper) but also on a screen that’s this wide. The 21:9 aspect ratio also offers a good Field of View advantage in most titles, as explored in our article on the topic linked to previously. The images below, which again tend to exaggerate the curve, in no way indicate the image quality when observing the screen in person. They’re simply there to fire up your imagination and also demonstrate the screen in action with its 21:9 aspect ratio. The titles shown are, respectively; BF1, Dirt Rally and Wolfenstein II: The New Colossus. Some users will want to use the monitor at a lower resolution than the native 2560 x 1440 (WQHD). Perhaps for performance reasons, or because they’re using a device such as a games console that doesn’t support the full native resolution. As usual for a G-SYNC monitor, there is no scaling functionality from the monitor itself when connected via DP – although the GPU can handle this instead if you’re a PC user. The monitor provides some basic scaling functionality via HDMI, however. The monitor can use an interpolation process to display a non-native resolution (such as 1920 x 1080 Full HD) using all 2560 x 1440 pixels of the screen. This is primarily designed for connecting devices such as games consoles or Blu-ray players that are limited to resolutions such as 1920 x 1080 (Full HD or ‘1080p’). If you wish to make use of the monitor’s scaling rather than the GPU scaling, via HDMI, you need to ensure the GPU driver is correctly configured so that the GPU doesn’t take over the scaling process. For those unconventional AMD users that are using this monitor, the driver is set up correctly by default to allow the monitor to interpolate where possible. Nvidia users should open Nvidia Control Panel and navigate to ‘Display – Adjust desktop size and position’. Ensure that ‘No Scaling’ is selected and ‘Perform scaling on:’ is set to ‘Display’ as shown in the following image. When running the monitor at 1920 x 1080 (Full HD) using the monitor’s interpolation process, there is a bit of softening compared to a native Full HD monitor of this size. This is not extreme, the monitor actually retains a decent degree of sharpness and texture detail. A fairly strong sharpness filter is used to avoid things looking too soft/blurry, although this has the opposite effect and makes things look somewhat over-sharpened. Things don’t look as naturally detailed (or natural in general) as a native 27” Full HD display, but it’s passable especially if you’ll be using it from some distance (for example, with a games console and controller). As usual, if you’re running the monitor at 2560 x 1440 and viewing 1920 x 1080 content (for example a video over the internet or a Blu-ray, using movie software) then it is the GPU and software that handles the upscaling. That’s got nothing to do with the monitor itself – there is a little bit of softening to the image compared to viewing such content on a native Full HD monitor, but it’s not extreme and shouldn’t bother most users. The video below summarises some of the key points raised in this written review and shows the monitor in action. The video review is designed to complement the written piece and is not nearly as comprehensive. High refresh rate 2560 x 1440 monitors now come in various sizes and panel types. For many the 27” screen size hits the sweet spot between immersion and pixel density, whilst the TN panel type offers the snappy pixel responses that can also be endearing. The AOC AG273QCG ticks both boxes, coupling them with a 1800R curve and a unique design. The curve isn’t something which dramatically changes the experience, it’s a subtle but in our view welcome addition which users shouldn’t shy away from. But at the same time, shouldn’t expect miracles from. The design of this AGON 3 product landed it a Red Dot Design Award when it was initially unveiled in 2018. Key ergonomic flexibility (tilt, swivel and height adjustment) is maintained and VESA mounting is also an option if the integrated stand doesn’t suit. We also liked the flexibility and utility offered by the ‘Light FX’ RGB lighting solution of the monitor. Whilst some settings were admittedly a bit gimmicky, the level of customisation and ability to set things up as a fairly effective bias light was certainly praiseworthy. In terms of contrast the monitor put in a reasonable performance, largely in line with our expectations given the panel type. Static contrast fell a bit below the specified 1000:1, particularly after suitable colour channel adjustments were made. But not enough of a drop in that respect to significantly change the viewing experience. Although it’s not something all users are sensitive to, we did find the screen surface too grainy for our taste and would’ve preferred a lighter solution with a smoother surface texture. As seen on all but the oldest revisions of the Dell S2716DG, for example. One area where the AOC has an unequivocal advantage over the Dell, though, is its gamma handling. It was still bound by the usual perceived gamma shifts that go with the TN territory. But the central gamma was much closer to the desired ‘2.2’ curve. This helped avoid the sort of ‘unintended detail’ revealed on the Dell (‘blockiness’ or ‘banding’) which persists to an extent even after calibration. The gamma handling also ensured the overall look to the image was rich. Even with the TN related saturation shifts accounted for, which weakened saturation lower down the screen but not to an extreme enough degree to really make things look ‘washed out’. The colour gamut was not as generous as that seen on some models, either, and that’s something that would invite a bit of extra saturation and vibrancy. This wouldn’t be to everyone’s taste, though, and some would prefer just the slight overextension beyond sRGB offered by this model. Perceived vibrancy would also be enhanced by a lighter screen surface, although the glare handling is certainly quite strong which will appeal to some users as well. The most impressive aspect of this model was undoubtedly its responsiveness. Input lag was very low and the 165Hz refresh rate was delivered in a very convincing way thanks to rapid overall pixel responsiveness. There were no real standout weaknesses in terms of pixel responsiveness, either. A bit of overshoot in places, but nothing as eye-catching as what can be seen on models like the Dell S2716DG. G-SYNC also worked nicely to rid the experience of tearing and stuttering that would otherwise be caused by frame rate and refresh rate mismatches. The alternative Nvidia-specific operating mode, ULMB, was also available and certainly worked to reduce overall perceived blur. But there was quite a bit of strobe crosstalk, which meant the experience was not as ‘clean’ as some strobe backlight implementations. Overall we feel that the positives of this product outweigh the negatives, especially if you weight things towards responsiveness. As noted in our post on the subject, the ‘recommended badge’ is awarded based on our own personal expectations and experiences with a monitor and it ultimately weighted towards our personal preferences. With that said, it’s something we’d be quite happy to award this monitor were it not for the screen surface. It’s something that soured the experience for us, particularly as we use a Dell S2716DG as a reference monitor. But it’s something you’ll have to weigh up against your own personal tolerances. The bottom line; a very responsive monitor with a nice design and a solid gaming feature-set, improving on the Dell S2716DG in many ways – except for smoothness of the screen surface.

The Spyder5ELITE was used to assess the uniformity of lighter colours, represented by 9 equally spaced white quadrants running from the top left to bottom right of the screen. The table below shows the luminance recorded at each quadrant as well as the percentage deviation between each quadrant and the brightest recorded point.
Luminance uniformity table
Luminance uniformity map
Contrast in games and movies
Lagom contrast tests
Colour reproduction
Colour gamut
Colour gamut test settings
Colour in games and movies
Viewing angles
The following video shows the Lagom text test, a mixed desktop background and dark desktop background from various viewing angles. It shows that there are strong shifts in contrast and colour from steeper viewing angles, particularly vertically. There is some colour inversion beyond a point vertically as well. The final section of the video highlights some ‘TN glow’ observed from steeper viewing angles, with a silverish or golden sheen (depending on viewing angle). This isn’t clearly observed from a regular viewing position, however.
Interlace pattern artifacts
Responsiveness
Input lag
Perceived blur (pursuit photography)
Responsiveness in games and movies
G-SYNC – the technology and activating it
Enable G-SYNC
Set Monitor Technology to G-SYNC
Set VSync according to preferences
G-SYNC – the experience
ULMB (Ultra Low Motion Blur)
Set Monitor Technology to ULMB
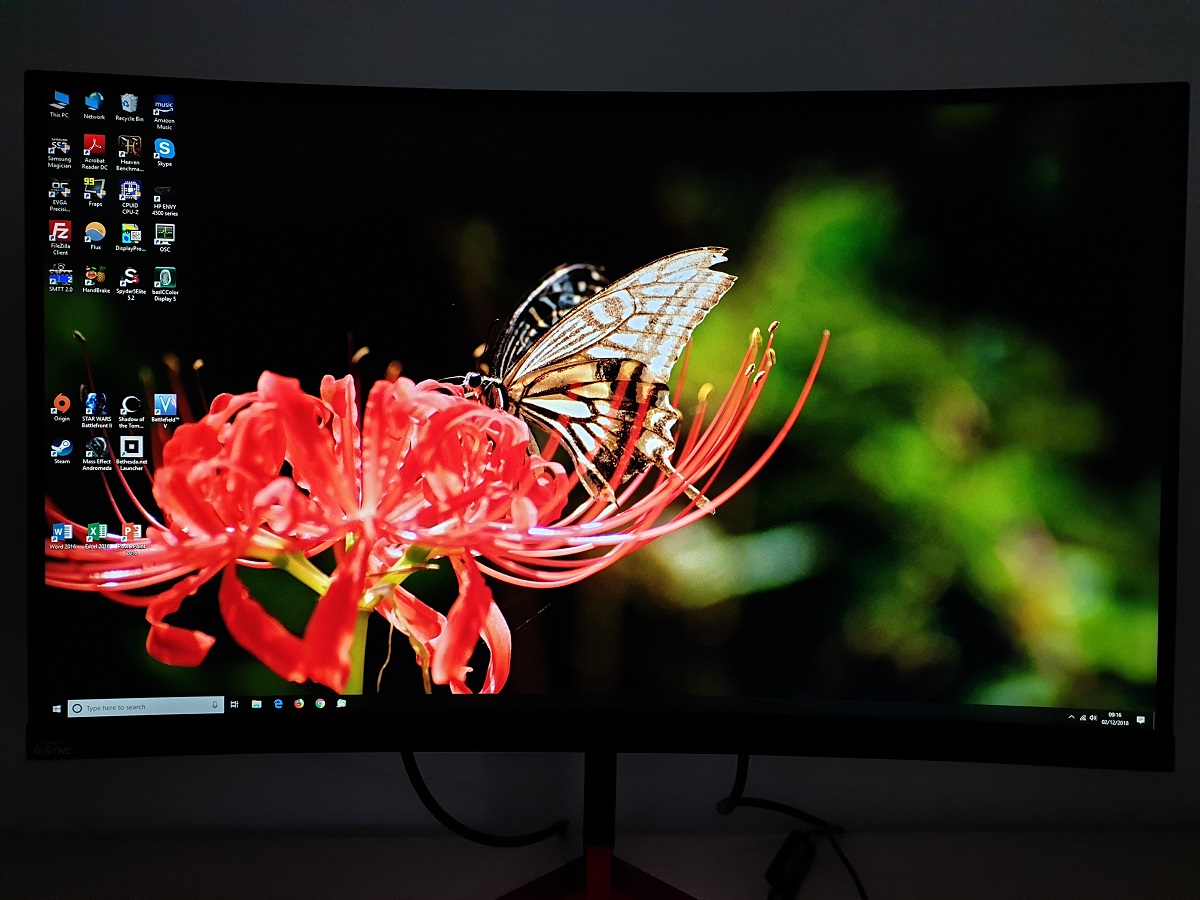
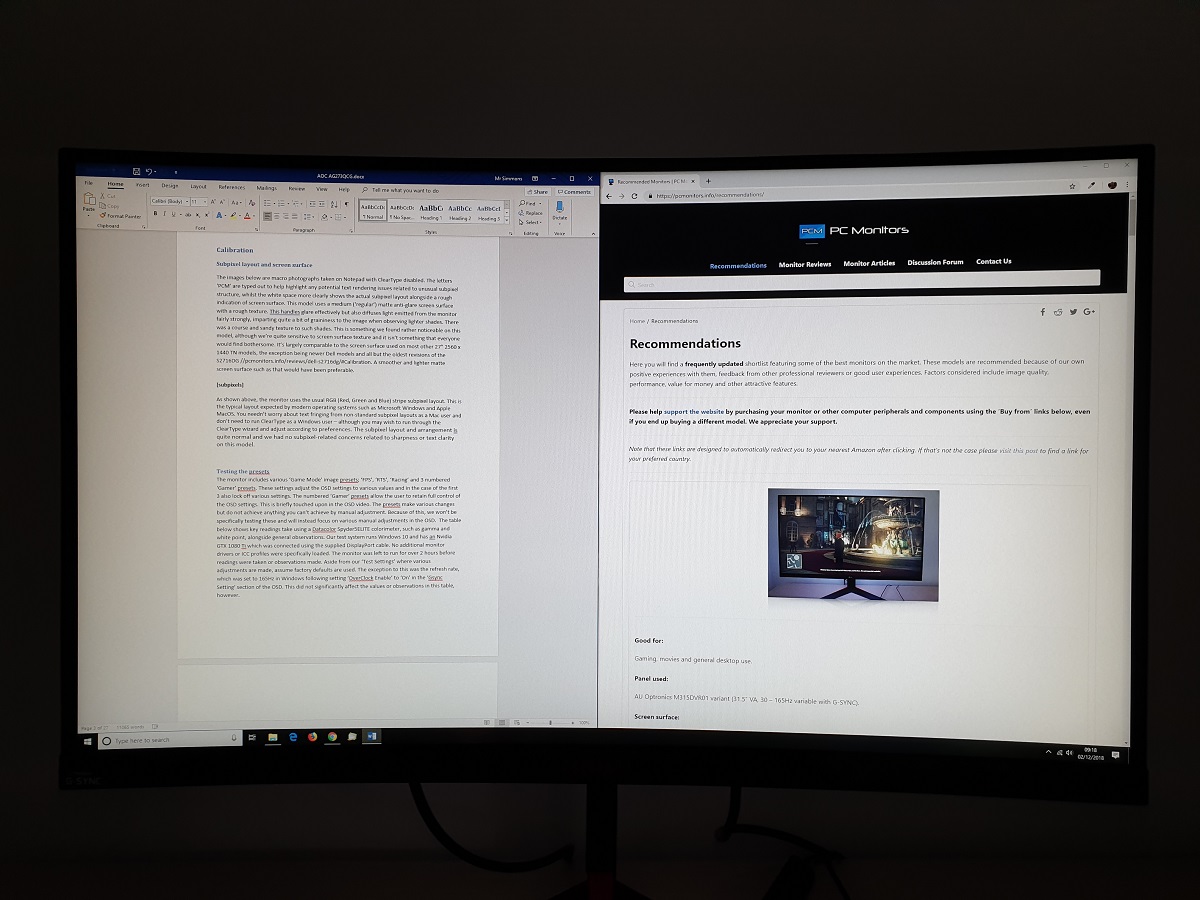
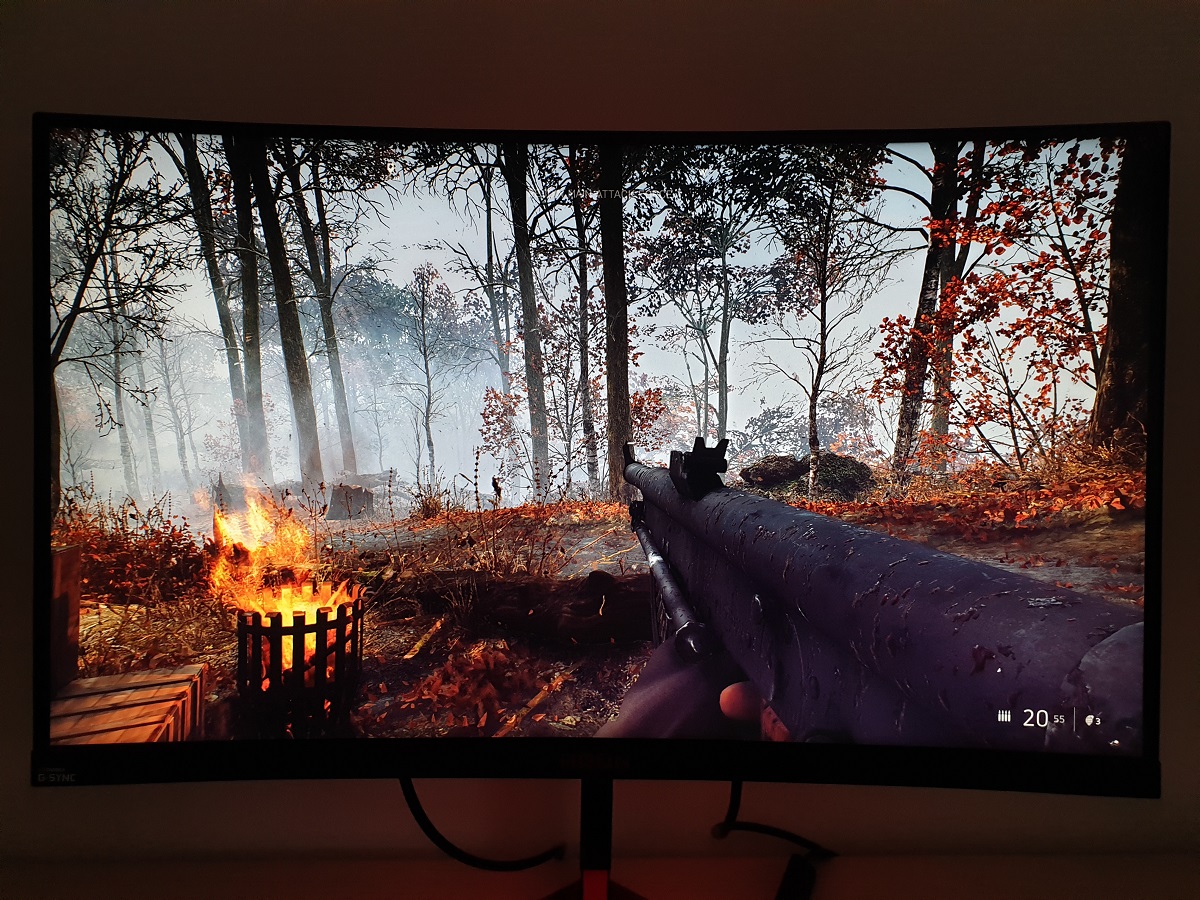
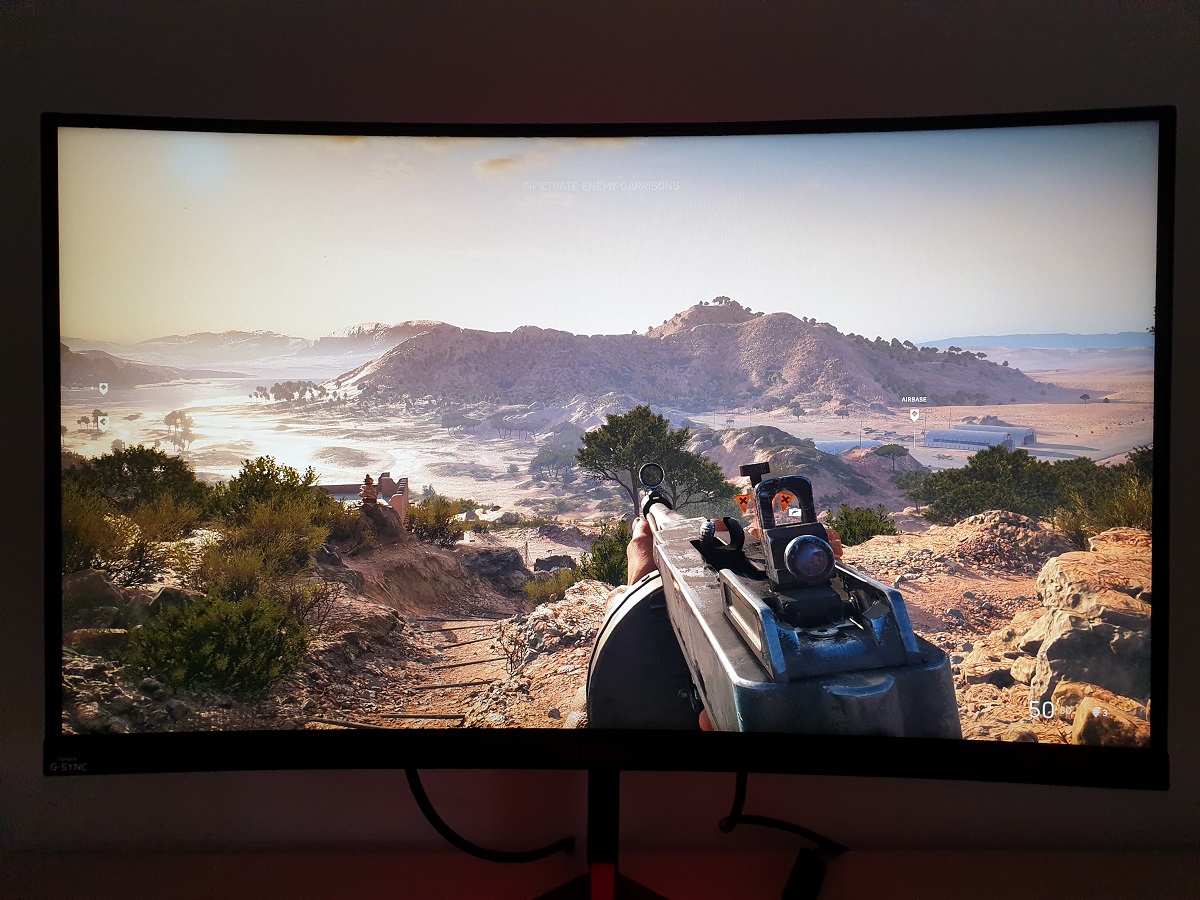
The 27” 2560 x 1440 curved experience
Interpolation and upscaling

Video review
Timestamps:
Features & Aesthetics
Contrast
Colour reproduction
Responsiveness
Conclusion
Positives Negatives Good gamma tracking and decent sRGB colour space coverage, providing quite a rich and natural look to the image overall TN related viewing angle and colour consistency weaknesses, some users would prefer a more generous colour gamut for a hint of extra saturation and vibrancy Strong glare handling from the screen surface, reasonable static contrast and no ‘IPS glow’ Static contrast fell a bit short of the panel specifications and the screen surface gives a grainy appearance to lighter shades (a pet hate of ours which not everyone shares) Low input lag and a strong 165Hz performance, with excellent overall pixel responsiveness and G-SYNC working as it should A little overshoot in places, ULMB not as well-tuned as it could be A nice design, reworked OSD and a surprisingly flexible and potentially useful ‘Light FX’ RGB lighting feature. Also a decent resolution and pixel density The stand could’ve been a bit more solid and premium-feeling, perhaps with some brushed metal in place of plastic
![]()

